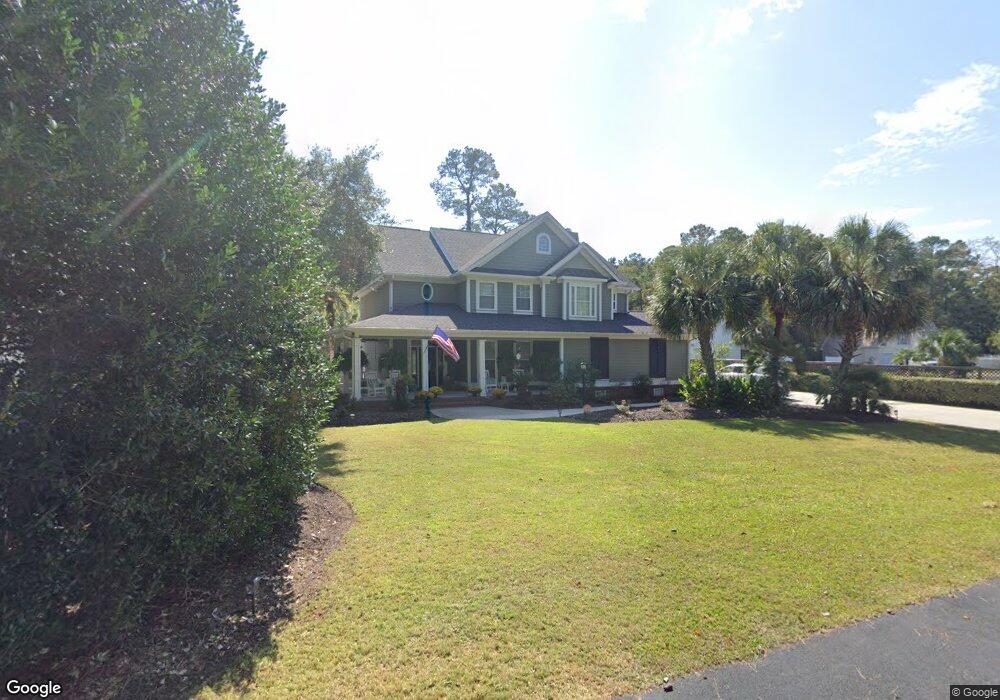
4020 Bayfield Loop Murrells Inlet, SC 29576
Estimated Value: $779,000 - $975,000
4
Beds
2
Baths
3,127
Sq Ft
$290/Sq Ft
Est. Value
About This Home
This home is located at 4020 Bayfield Loop, Murrells Inlet, SC 29576 and is currently estimated at $908,026, approximately $290 per square foot. 4020 Bayfield Loop is a home located in Georgetown County with nearby schools including Waccamaw Elementary School, Waccamaw Intermediate School, and Waccamaw Middle School.
Ownership History
Date
Name
Owned For
Owner Type
Purchase Details
Closed on
Feb 9, 2024
Sold by
Demer Gregory W and Demer Rachel Romana
Bought by
Chowansky Joseph R and Chowansky Angela Susan
Current Estimated Value
Purchase Details
Closed on
Feb 21, 2023
Sold by
Demer Gergory W
Bought by
Demer Gregory W and Demer Rachel Romana
Purchase Details
Closed on
Apr 14, 2021
Sold by
Coleman Kenneth Ray and Coleman Sabrina C
Bought by
Demer Gergory W
Home Financials for this Owner
Home Financials are based on the most recent Mortgage that was taken out on this home.
Original Mortgage
$548,000
Interest Rate
3.1%
Mortgage Type
New Conventional
Purchase Details
Closed on
Dec 12, 2000
Sold by
Bellamy Properties Inc and Bellamy Ruby Cannon
Bought by
Coleman Kenneth Ray and Coleman Sabrina C
Create a Home Valuation Report for This Property
The Home Valuation Report is an in-depth analysis detailing your home's value as well as a comparison with similar homes in the area
Home Values in the Area
Average Home Value in this Area
Purchase History
| Date | Buyer | Sale Price | Title Company |
|---|---|---|---|
| Chowansky Joseph R | $915,000 | None Listed On Document | |
| Demer Gregory W | -- | -- | |
| Demer Gergory W | $579,900 | None Available | |
| Coleman Kenneth Ray | $42,900 | -- |
Source: Public Records
Mortgage History
| Date | Status | Borrower | Loan Amount |
|---|---|---|---|
| Previous Owner | Demer Gergory W | $548,000 |
Source: Public Records
Tax History Compared to Growth
Tax History
| Year | Tax Paid | Tax Assessment Tax Assessment Total Assessment is a certain percentage of the fair market value that is determined by local assessors to be the total taxable value of land and additions on the property. | Land | Improvement |
|---|---|---|---|---|
| 2024 | $3,068 | $21,520 | $3,600 | $17,920 |
| 2023 | $3,068 | $21,520 | $3,600 | $17,920 |
| 2022 | $2,562 | $21,520 | $3,600 | $17,920 |
| 2021 | $1,610 | $13,668 | $2,400 | $11,268 |
| 2020 | $1,606 | $13,668 | $2,400 | $11,268 |
| 2019 | $1,654 | $14,312 | $2,400 | $11,912 |
| 2018 | $1,696 | $143,120 | $0 | $0 |
| 2017 | $1,487 | $143,120 | $0 | $0 |
| 2016 | $1,471 | $14,186 | $0 | $0 |
| 2015 | $1,268 | $0 | $0 | $0 |
| 2014 | $1,268 | $308,400 | $54,400 | $254,000 |
| 2012 | -- | $308,400 | $54,400 | $254,000 |
Source: Public Records
Map
Nearby Homes
- 4004 Bayfield Loop
- 4691 Mill Pond Ct
- 1099 Wachesaw Rd
- 4502 Firethorne Dr
- 853 Wachesaw Rd
- 1095 Wachesaw Rd
- 1201 Wachesaw Rd
- 4504 Fulton Place
- 50 Turning Stone Blvd Unit 5
- 50 Turning Stone Blvd Unit 7
- 416 Fountain Grass Ct Unit 6E
- 404 Fountain Grass Ct Unit 6B
- 400 Fountain Grass Ct Unit 6A
- 412 Fountain Grass Ct Unit 6D
- 408 Fountain Grass Ct Unit 6C
- 613 Fairgrass Ct Unit 35E
- 4568 Painted Fern Ct Unit 2B
- 211 Chesapeake Ln
- 10 Logan Berry Ct Unit H
- 4645 Fringetree Dr Unit 10F
- 4020 Bayfield Loop Unit Wachesaw Road
- 4022 Bayfield Loop
- 4013 Pine Needle Ct Unit Bayfield
- 4013 Pine Needle Ct
- 4015 Pine Needle Ct
- 4024 Bayfield Loop
- 4014 Pine Needle Ct
- 4012 Bayfield Loop
- 4010 Bayfield Loop
- 4026 Bayfield Loop
- 4035 Bayfield Loop
- 4008 Bayfield Loop
- 4033 Bayfield Loop
- 4037 Bayfield Loop
- 4028 Bayfield Loop
- 4006 Bayfield Loop
- 4031 Bayfield Loop
- 4030 Bayfield Loop
- 4626 Burnt Oak Ct
- 4626 Burnt Oak Ct Unit HISTORIC WACHESAW PL