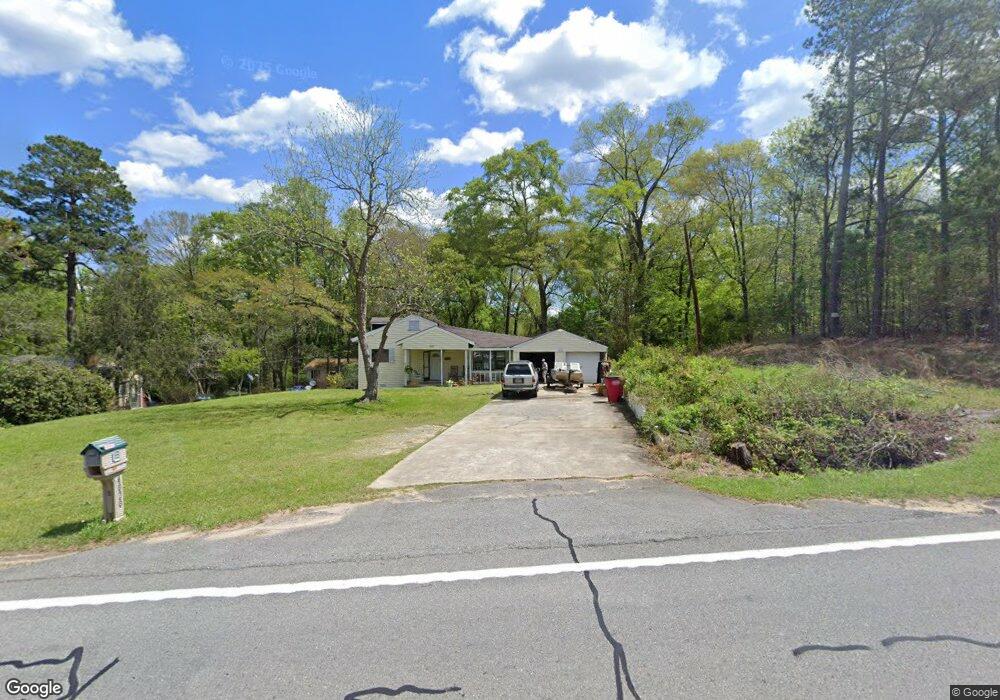
4020 Ocmulgee East Blvd Macon, GA 31217
Estimated Value: $124,000 - $137,589
3
Beds
2
Baths
1,606
Sq Ft
$81/Sq Ft
Est. Value
About This Home
This home is located at 4020 Ocmulgee East Blvd, Macon, GA 31217 and is currently estimated at $129,647, approximately $80 per square foot. 4020 Ocmulgee East Blvd is a home located in Bibb County with nearby schools including Bernd Elementary School, Appling Middle School, and Northeast High School.
Ownership History
Date
Name
Owned For
Owner Type
Purchase Details
Closed on
Feb 12, 2025
Sold by
Crider Elizabeth Ann
Bought by
Cox Billy Joe and Cox Wanda Faye
Current Estimated Value
Purchase Details
Closed on
Jan 21, 2025
Sold by
Crider Paul Vincent
Bought by
Cox Billy Joe and Cox Wanda Faye
Purchase Details
Closed on
Aug 23, 2011
Sold by
Citimortgage Inc
Bought by
Crider Paul
Purchase Details
Closed on
Oct 5, 2010
Sold by
Clayton Linda C and Clayton Fred T
Bought by
Citimortgage Inc
Purchase Details
Closed on
Nov 30, 2005
Sold by
Shirah Pamela Lynn and Peskoe Pamela S
Bought by
Clayton Linda C and Clayton Fred T
Home Financials for this Owner
Home Financials are based on the most recent Mortgage that was taken out on this home.
Original Mortgage
$60,800
Interest Rate
6.5%
Mortgage Type
Adjustable Rate Mortgage/ARM
Create a Home Valuation Report for This Property
The Home Valuation Report is an in-depth analysis detailing your home's value as well as a comparison with similar homes in the area
Home Values in the Area
Average Home Value in this Area
Purchase History
| Date | Buyer | Sale Price | Title Company |
|---|---|---|---|
| Cox Billy Joe | $25,000 | None Listed On Document | |
| Cox Billy Joe | $25,000 | None Listed On Document | |
| Crider Paul | $5,000 | None Available | |
| Citimortgage Inc | $44,512 | None Available | |
| Clayton Linda C | $76,000 | None Available |
Source: Public Records
Mortgage History
| Date | Status | Borrower | Loan Amount |
|---|---|---|---|
| Previous Owner | Clayton Linda C | $60,800 |
Source: Public Records
Tax History Compared to Growth
Tax History
| Year | Tax Paid | Tax Assessment Tax Assessment Total Assessment is a certain percentage of the fair market value that is determined by local assessors to be the total taxable value of land and additions on the property. | Land | Improvement |
|---|---|---|---|---|
| 2025 | $903 | $36,751 | $2,821 | $33,930 |
| 2024 | $933 | $36,751 | $2,821 | $33,930 |
| 2023 | $933 | $36,751 | $2,821 | $33,930 |
| 2022 | $1,235 | $35,664 | $8,464 | $27,200 |
| 2021 | $1,324 | $34,855 | $6,670 | $28,185 |
| 2020 | $1,353 | $34,855 | $6,670 | $28,185 |
| 2019 | $1,364 | $34,855 | $6,670 | $28,185 |
| 2018 | $2,270 | $34,855 | $6,670 | $28,185 |
| 2017 | $1,306 | $34,855 | $6,670 | $28,185 |
| 2016 | $1,206 | $34,855 | $6,670 | $28,185 |
| 2015 | $1,707 | $34,855 | $6,670 | $28,185 |
| 2014 | $1,709 | $34,855 | $6,670 | $28,185 |
Source: Public Records
Map
Nearby Homes
- 3954 Ocmulgee Blvd E
- 1995 Crooms Dr
- 2708 Herbert Smart Airport Rd
- 4462 Riggins Mill Rd
- 5055 Riggins Mill Rd
- 3830 Brenda Dr
- 3706 Riggins Mill Rd
- 4255 Training School Rd
- 2766 Stanley Dr
- 2776 Stanley Dr
- 5151 Riggins Mill Rd
- 3320 Jones Dr
- 3164 Riggins Mill Rd
- 3335 Esther Dr
- 3411 Jeffersonville Rd
- 3909 Jeffersonville Rd
- 3917 Jeffersonville Rd
- 4010 Ocmulgee East Blvd
- 4014 Ocmulgee East Blvd
- 4030 Ocmulgee East Blvd
- 4025 Ocmulgee East Blvd
- 4019 Ocmulgee East Blvd
- 4033 Ocmulgee Blvd E
- 4033 Ocmulgee East Blvd
- 4045 Ocmulgee East Blvd
- 4056 Ocmulgee Blvd E
- 4056 Ocmulgee East Blvd
- 4051 Ocmulgee East Blvd
- 3995 Ocmulgee East Blvd
- 4011 Ocmulgee East Blvd
- 4059 Ocmulgee East Blvd
- 4000 Ocmulgee East Blvd
- 4076 Ocmulgee East Blvd
- 3954 Ocmulgee East Blvd
- 4073 Ocmulgee East Blvd
- 4082 Ocmulgee East Blvd
- 0 Mar-Sha Dr