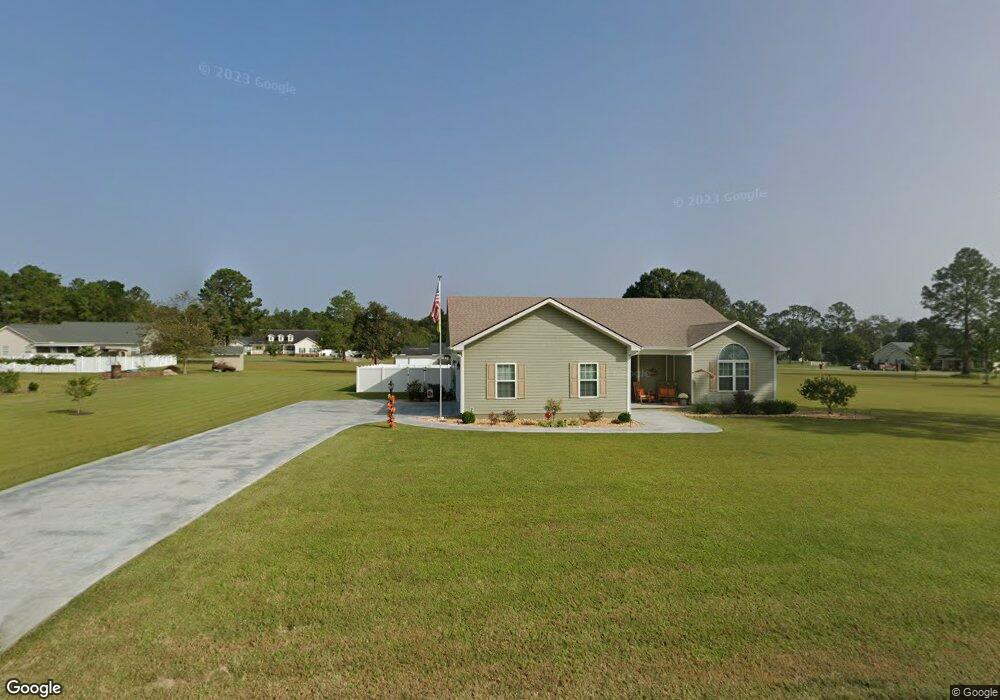
4020 Redstone Cir Blackshear, GA 31516
Estimated Value: $307,707 - $405,000
3
Beds
2
Baths
1,814
Sq Ft
$191/Sq Ft
Est. Value
About This Home
This home is located at 4020 Redstone Cir, Blackshear, GA 31516 and is currently estimated at $346,177, approximately $190 per square foot. 4020 Redstone Cir is a home with nearby schools including Pierce County High School, Southeast Christian Academy, and Truth Christian Academy.
Ownership History
Date
Name
Owned For
Owner Type
Purchase Details
Closed on
Jul 30, 2024
Sold by
Jones Belinda
Bought by
Jones Jeffry Paul and Jones Ryan Patrick
Current Estimated Value
Purchase Details
Closed on
Aug 18, 2020
Sold by
Dixon William Austin
Bought by
Jones Belinda and Jones John P
Purchase Details
Closed on
Mar 22, 2007
Sold by
Zwartjes George B
Bought by
Dixon William Austin and King Kristi Marie
Home Financials for this Owner
Home Financials are based on the most recent Mortgage that was taken out on this home.
Original Mortgage
$19,513
Interest Rate
6.18%
Mortgage Type
New Conventional
Purchase Details
Closed on
Jan 5, 2006
Sold by
Roc Enterprises Inc
Bought by
Swartjes George B and Swartjes Robin
Purchase Details
Closed on
Oct 25, 2002
Sold by
Kennerly Roy W
Bought by
Roc Enterprises Inc
Purchase Details
Closed on
May 18, 1994
Sold by
Aldridge Bonnie L Etal
Bought by
Kennerly Roy W
Create a Home Valuation Report for This Property
The Home Valuation Report is an in-depth analysis detailing your home's value as well as a comparison with similar homes in the area
Home Values in the Area
Average Home Value in this Area
Purchase History
| Date | Buyer | Sale Price | Title Company |
|---|---|---|---|
| Jones Jeffry Paul | -- | -- | |
| Jones Belinda | $17,000 | -- | |
| Dixon William Austin | $22,000 | -- | |
| Swartjes George B | $195,000 | -- | |
| Roc Enterprises Inc | $6,200 | -- | |
| Kennerly Roy W | -- | -- |
Source: Public Records
Mortgage History
| Date | Status | Borrower | Loan Amount |
|---|---|---|---|
| Previous Owner | Dixon William Austin | $19,513 |
Source: Public Records
Tax History
| Year | Tax Paid | Tax Assessment Tax Assessment Total Assessment is a certain percentage of the fair market value that is determined by local assessors to be the total taxable value of land and additions on the property. | Land | Improvement |
|---|---|---|---|---|
| 2025 | $2,745 | $112,759 | $7,000 | $105,759 |
| 2024 | $1,781 | $108,749 | $7,000 | $101,749 |
| 2023 | $1,781 | $104,018 | $4,800 | $99,218 |
| 2022 | $2,034 | $82,784 | $8,800 | $73,984 |
| 2021 | $1,226 | $46,254 | $8,800 | $37,454 |
| 2020 | $237 | $8,800 | $8,800 | $0 |
| 2019 | $239 | $8,800 | $8,800 | $0 |
| 2018 | $238 | $8,800 | $8,800 | $0 |
| 2017 | $242 | $8,800 | $8,800 | $0 |
| 2016 | $240 | $8,800 | $8,800 | $0 |
| 2015 | $197 | $8,800 | $8,800 | $0 |
| 2014 | $197 | $8,800 | $8,800 | $0 |
| 2013 | $197 | $8,800 | $8,800 | $0 |
Source: Public Records
Map
Nearby Homes
- 3952 Golfview Dr
- 4005 Golfview Dr
- 180 Heritage Cir
- 1120 Lakeview Dr
- 1120 College Ave
- 948 Azalea St
- 918 Main St
- 118 Pinehurst Dr
- 4125 Mulligan Cir
- 4131 Mulligan Cir
- 150 Pittman St
- 3889 Jacobs Dr
- 915 Jane St
- 622 E Main St
- 854 Jenkins St
- 517 Lazy Ln
- 594 Pinehurst Dr
- 3547 Chapel Ln
- 3433 Pecan Ln
- ST. ROUTE 121 Georgia 121
- 4004 Redstone Cir
- 4014 Redstone Cir
- 4006 Redstone Cir
- 4021 Redstone Cir
- 00 Redstone Cir
- 000 Redstone Cir
- Lot 6 Redstone Cir
- 0 Redstone Cir
- Lot 11 Redstone Cir
- 4019 Redstone Cir
- 4031 Redstone Cir
- 4025 Redstone Cir
- 4003 Redstone Cir
- 4009 Eagle Dr
- 4005 Redstone Cir
- 4011 Eagle Dr
- 4007 Eagle Dr
- 5636 Ga Highway 121
- 4013 Eagle Dr
- 4005 Eagle Dr
Your Personal Tour Guide
Ask me questions while you tour the home.