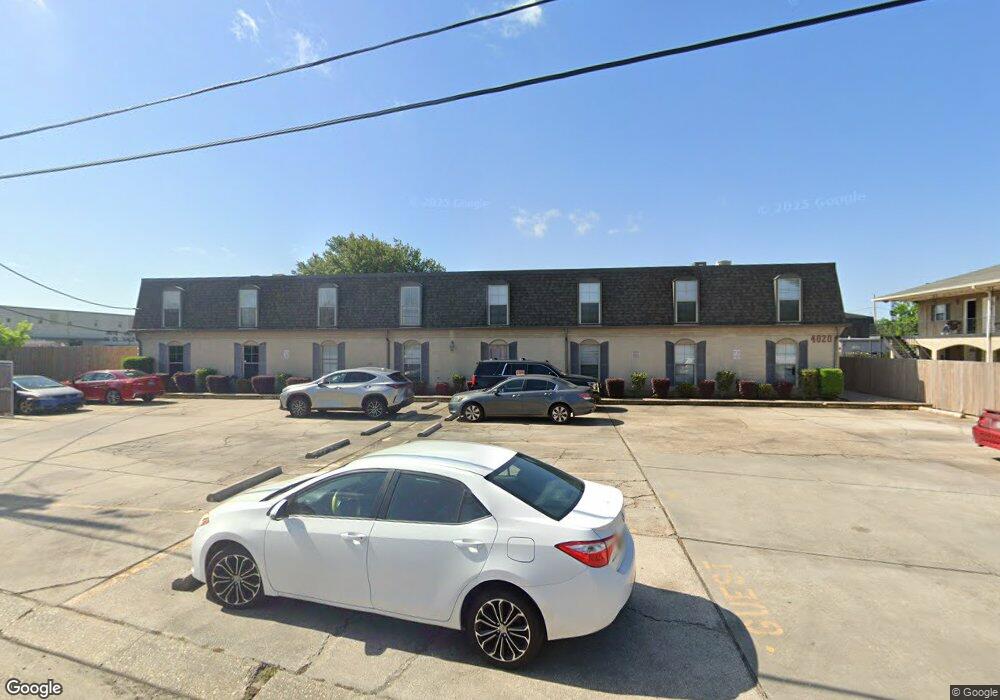
4020 Rye St Unit 8 Metairie, LA 70002
New Metairie North NeighborhoodEstimated Value: $96,919 - $129,000
2
Beds
1
Bath
800
Sq Ft
$137/Sq Ft
Est. Value
About This Home
This home is located at 4020 Rye St Unit 8, Metairie, LA 70002 and is currently estimated at $109,730, approximately $137 per square foot. 4020 Rye St Unit 8 is a home located in Jefferson Parish with nearby schools including Alice M. Birney Elementary School, Metairie Academy For Advanced Studies, and J.D. Meisler Middle School.
Ownership History
Date
Name
Owned For
Owner Type
Purchase Details
Closed on
Feb 7, 2024
Sold by
Buy N Hold Dat Llc
Bought by
Lanclos Dale
Current Estimated Value
Home Financials for this Owner
Home Financials are based on the most recent Mortgage that was taken out on this home.
Original Mortgage
$72,000
Outstanding Balance
$70,669
Interest Rate
6.66%
Mortgage Type
New Conventional
Estimated Equity
$39,061
Purchase Details
Closed on
Oct 27, 2023
Sold by
Buy N Hold Dat Llc
Bought by
Lanclos Dale
Purchase Details
Closed on
Dec 10, 2021
Sold by
Gagnet Morgan Ashley
Bought by
Buy N Hold Dat Llc
Purchase Details
Closed on
Mar 10, 2008
Sold by
Flip Enterprises Llc
Bought by
Gagnet Ashley
Home Financials for this Owner
Home Financials are based on the most recent Mortgage that was taken out on this home.
Original Mortgage
$123,500
Interest Rate
5.47%
Mortgage Type
New Conventional
Create a Home Valuation Report for This Property
The Home Valuation Report is an in-depth analysis detailing your home's value as well as a comparison with similar homes in the area
Home Values in the Area
Average Home Value in this Area
Purchase History
| Date | Buyer | Sale Price | Title Company |
|---|---|---|---|
| Lanclos Dale | -- | Gulf South Title | |
| Lanclos Dale | -- | None Listed On Document | |
| Buy N Hold Dat Llc | $88,000 | None Listed On Document | |
| Buy N Hold Dat Llc | $88,000 | Gulf South Title Corp | |
| Gagnet Ashley | $130,000 | -- |
Source: Public Records
Mortgage History
| Date | Status | Borrower | Loan Amount |
|---|---|---|---|
| Open | Lanclos Dale | $72,000 | |
| Previous Owner | Gagnet Ashley | $123,500 |
Source: Public Records
Tax History Compared to Growth
Tax History
| Year | Tax Paid | Tax Assessment Tax Assessment Total Assessment is a certain percentage of the fair market value that is determined by local assessors to be the total taxable value of land and additions on the property. | Land | Improvement |
|---|---|---|---|---|
| 2024 | $3,692 | $9,270 | $5,880 | $3,390 |
| 2023 | $1,220 | $9,270 | $5,880 | $3,390 |
| 2022 | $1,188 | $9,270 | $5,880 | $3,390 |
| 2021 | $1,103 | $9,270 | $5,880 | $3,390 |
| 2020 | $1,095 | $9,270 | $5,880 | $3,390 |
| 2019 | $1,126 | $9,270 | $4,710 | $4,560 |
| 2018 | $1,051 | $9,270 | $4,710 | $4,560 |
| 2017 | $1,051 | $9,270 | $4,710 | $4,560 |
| 2016 | $1,031 | $9,270 | $4,710 | $4,560 |
| 2015 | $1,012 | $9,000 | $3,770 | $5,230 |
| 2014 | $1,012 | $9,000 | $3,770 | $5,230 |
Source: Public Records
Map
Nearby Homes
- 2920 Lake Villa Dr
- 2817 Independence St
- 2912 Houma Blvd
- 2916 Danny Park
- 3408 Lake Villa Dr
- 3456 Cleary Ave Unit 103
- 3508 Richland Ave
- 4009 Newlands St
- 2509 Giuffrias Ave Unit 605
- 2509 Giuffrias Ave Unit 621
- 2500 Manson Ave Unit 414
- 2500 Manson Ave Unit 417
- 2808 Belmont Place
- 2905 Belmont Place
- 3924 Pharr St
- 4000 Loveland St
- 4412 N Turnbull Dr
- 2500 Houma Blvd Unit 303
- 4044 46 Georgetown Dr
- 4417 Yale St Unit A
- 4020 Rye St
- 4020 Rye St
- 4020 Rye St
- 4020 Rye St
- 4020 Rye St
- 4020 Rye St
- 4020 Rye St
- 4020 Rye St
- 4020 Rye St Unit 14
- 4020 Rye St Unit 10
- 4020 Rye St Unit 15
- 4020 Rye St Unit 1
- 4020 Rye St Unit 16
- 4020 Rye St Unit 7
- 4020 Rye St Unit 13
- 4020 Rye St Unit 12
- 4020 Rye St Unit 2
- 4020 Rye St Unit 9
- 4020 Rye St Unit 4
- 4020 Rye St Unit 11