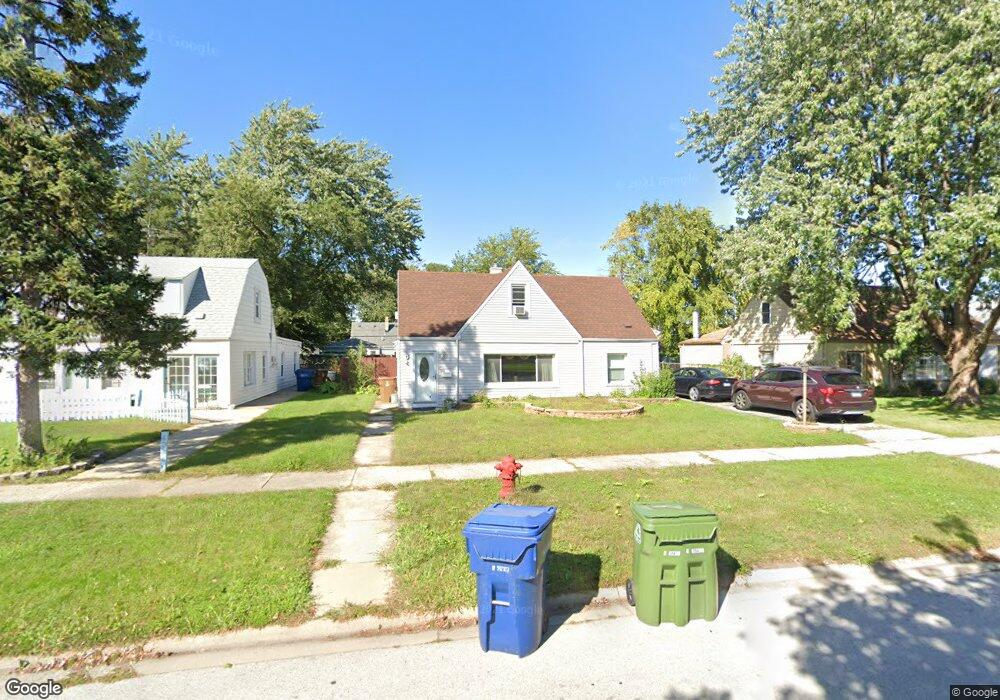
4020 W 99th Place Oak Lawn, IL 60453
Estimated Value: $288,000 - $326,000
3
Beds
2
Baths
1,620
Sq Ft
$188/Sq Ft
Est. Value
About This Home
This home is located at 4020 W 99th Place, Oak Lawn, IL 60453 and is currently estimated at $304,565, approximately $188 per square foot. 4020 W 99th Place is a home located in Cook County with nearby schools including Sward Elementary School, Kolmar Avenue Elementary School, and Hometown Elementary School.
Ownership History
Date
Name
Owned For
Owner Type
Purchase Details
Closed on
Apr 19, 2017
Sold by
Hauser Erick R and Santos Mildred
Bought by
Casas Mildred Santos and Rich Ryan
Current Estimated Value
Home Financials for this Owner
Home Financials are based on the most recent Mortgage that was taken out on this home.
Original Mortgage
$129,000
Interest Rate
4.02%
Mortgage Type
New Conventional
Purchase Details
Closed on
Aug 12, 2014
Sold by
Hauser Erick R
Bought by
Santos Mildred and Hauser Erick R
Home Financials for this Owner
Home Financials are based on the most recent Mortgage that was taken out on this home.
Original Mortgage
$119,500
Interest Rate
4.11%
Mortgage Type
New Conventional
Purchase Details
Closed on
Feb 25, 2004
Sold by
Hauser Erick R
Bought by
Hauser Erick R and Santos Mildred
Create a Home Valuation Report for This Property
The Home Valuation Report is an in-depth analysis detailing your home's value as well as a comparison with similar homes in the area
Home Values in the Area
Average Home Value in this Area
Purchase History
| Date | Buyer | Sale Price | Title Company |
|---|---|---|---|
| Casas Mildred Santos | -- | Attorney | |
| Santos Mildred | -- | -- | |
| Santos Mildred | -- | -- | |
| Hauser Erick R | -- | -- |
Source: Public Records
Mortgage History
| Date | Status | Borrower | Loan Amount |
|---|---|---|---|
| Previous Owner | Casas Mildred Santos | $129,000 | |
| Previous Owner | Santos Mildred | $119,500 |
Source: Public Records
Tax History Compared to Growth
Tax History
| Year | Tax Paid | Tax Assessment Tax Assessment Total Assessment is a certain percentage of the fair market value that is determined by local assessors to be the total taxable value of land and additions on the property. | Land | Improvement |
|---|---|---|---|---|
| 2024 | $6,646 | $24,000 | $5,502 | $18,498 |
| 2023 | $5,469 | $24,000 | $5,502 | $18,498 |
| 2022 | $5,469 | $17,295 | $4,716 | $12,579 |
| 2021 | $5,357 | $17,294 | $4,716 | $12,578 |
| 2020 | $5,391 | $17,294 | $4,716 | $12,578 |
| 2019 | $4,679 | $15,633 | $4,323 | $11,310 |
| 2018 | $4,502 | $15,633 | $4,323 | $11,310 |
| 2017 | $4,581 | $15,633 | $4,323 | $11,310 |
| 2016 | $4,255 | $13,376 | $3,537 | $9,839 |
| 2015 | $4,144 | $13,376 | $3,537 | $9,839 |
| 2014 | $4,106 | $13,376 | $3,537 | $9,839 |
| 2013 | $4,690 | $16,307 | $3,537 | $12,770 |
Source: Public Records
Map
Nearby Homes
- 4029 W 99th St
- 4035 Fitzjames Walk
- 4037 Trafalgar Ln
- 9831 S Karlov Ave
- 9820 S Pulaski Rd Unit 213
- 9820 S Pulaski Rd Unit 111
- 4108 W 99th St Unit C
- 4116 W 99th St Unit 1A
- 10001 Kedvale Ave
- 9826 S Harding Ave
- 4123 W 98th St Unit C
- 10048 S Pulaski Rd Unit 2B
- 9745 S Karlov Ave Unit 607
- 9740 S Pulaski Rd Unit 9740306
- 9740 S Pulaski Rd Unit 107
- 9720 S Pulaski Rd Unit 306
- 9720 S Pulaski Rd Unit 502
- 9720 S Pulaski Rd Unit 602
- 10036 Kedvale Ave
- 10100 S Pulaski Rd Unit 1E
- 4024 W 99th Place
- 4016 W 99th Place
- 4012 W 99th Place
- 4028 W 99th Place
- 4021 W 99th St
- 4025 W 99th St
- 4017 W 99th St
- 4013 W 99th St
- 4032 W 99th Place
- 4033 W 99th St
- 4021 W 99th Place
- 4017 W 99th Place
- 4025 W 99th Place
- 4037 W 99th St
- 9912 S Pulaski Rd
- 4013 W 99th Place
- 9916 S Pulaski Rd
- 4029 W 99th Place
- 9908 S Pulaski Rd
- 4036 W 99th Place