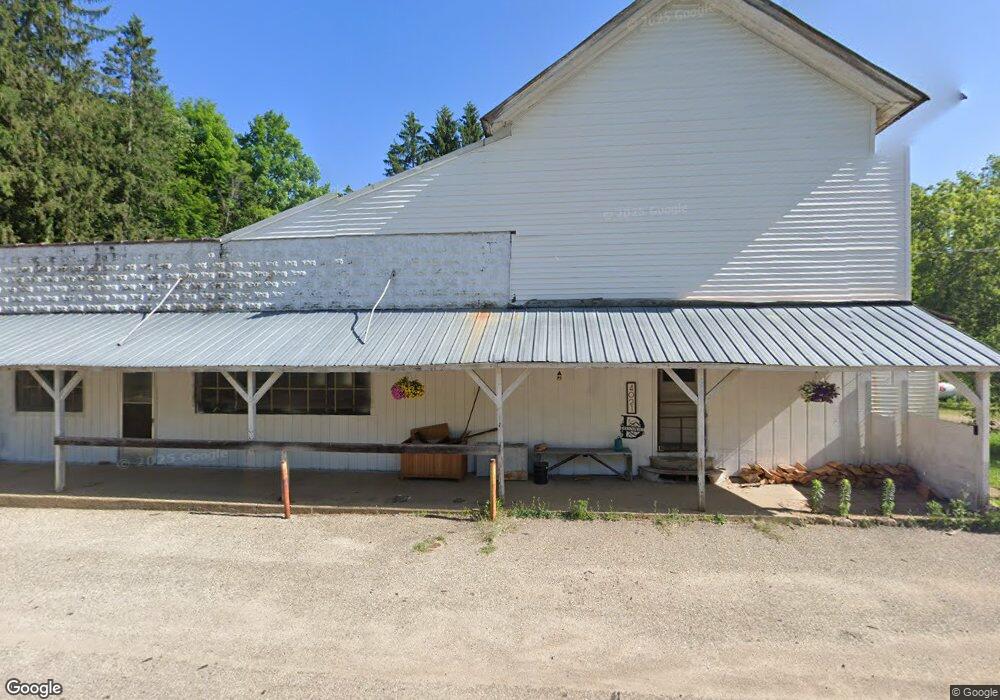
4021 104th Ave Allegan, MI 49010
Estimated Value: $32,276
--
Bed
--
Bath
5,084
Sq Ft
$6/Sq Ft
Est. Value
About This Home
This home is located at 4021 104th Ave, Allegan, MI 49010 and is currently estimated at $32,276, approximately $6 per square foot. 4021 104th Ave is a home located in Allegan County with nearby schools including Pine Trails Elementary School, L.E. White Middle School, and Allegan High School.
Ownership History
Date
Name
Owned For
Owner Type
Purchase Details
Closed on
Apr 24, 2024
Sold by
Venema Gary Vincent and Davenport Rebecca
Bought by
Davenport Rebecca and Davenport Jerry M
Current Estimated Value
Purchase Details
Closed on
Nov 17, 2010
Sold by
Venema Alice H
Bought by
Venema Gary Vincent
Purchase Details
Closed on
Jun 8, 2001
Sold by
Godfrey William E
Bought by
Venema Alice H
Purchase Details
Closed on
Mar 27, 1998
Sold by
Konecki Edward W
Bought by
Godfrey William and Godfrey Ellen
Create a Home Valuation Report for This Property
The Home Valuation Report is an in-depth analysis detailing your home's value as well as a comparison with similar homes in the area
Home Values in the Area
Average Home Value in this Area
Purchase History
| Date | Buyer | Sale Price | Title Company |
|---|---|---|---|
| Davenport Rebecca | $30,000 | None Listed On Document | |
| Venema Gary Vincent | -- | None Available | |
| Venema Alice H | -- | -- | |
| Godfrey William | -- | -- |
Source: Public Records
Tax History Compared to Growth
Tax History
| Year | Tax Paid | Tax Assessment Tax Assessment Total Assessment is a certain percentage of the fair market value that is determined by local assessors to be the total taxable value of land and additions on the property. | Land | Improvement |
|---|---|---|---|---|
| 2025 | $730 | $38,200 | $9,200 | $29,000 |
| 2024 | -- | $36,900 | $6,600 | $30,300 |
| 2023 | $1,232 | $32,300 | $6,600 | $25,700 |
| 2022 | $1,232 | $60,400 | $6,700 | $53,700 |
| 2021 | $1,232 | $57,700 | $5,100 | $52,600 |
| 2020 | $1,232 | $55,000 | $4,000 | $51,000 |
| 2019 | $0 | $55,000 | $4,100 | $50,900 |
| 2018 | $0 | $43,600 | $3,600 | $40,000 |
| 2017 | $0 | $28,700 | $3,500 | $25,200 |
| 2016 | $0 | $30,700 | $3,700 | $27,000 |
| 2015 | -- | $30,700 | $3,700 | $27,000 |
| 2014 | -- | $29,900 | $2,700 | $27,200 |
| 2013 | -- | $28,800 | $2,500 | $26,300 |
Source: Public Records
Map
Nearby Homes