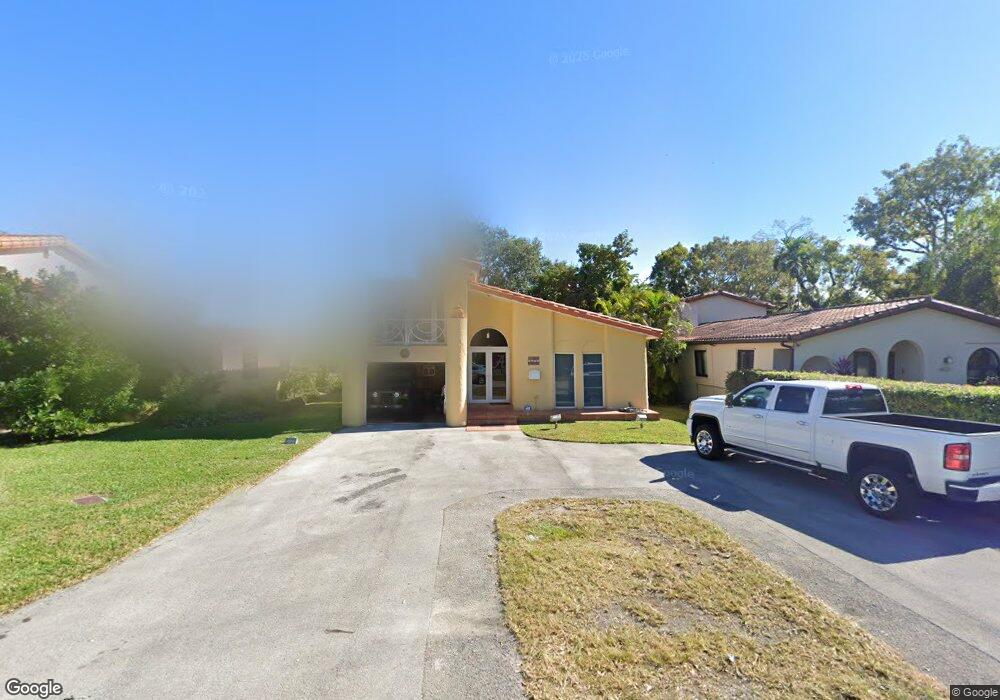
4021 Alhambra Cir Coral Gables, FL 33146
Country Club Section NeighborhoodEstimated Value: $1,114,188 - $1,532,000
3
Beds
2
Baths
1,825
Sq Ft
$709/Sq Ft
Est. Value
About This Home
This home is located at 4021 Alhambra Cir, Coral Gables, FL 33146 and is currently estimated at $1,293,297, approximately $708 per square foot. 4021 Alhambra Cir is a home located in Miami-Dade County with nearby schools including David Fairchild Elementary School, Ponce de Leon Middle School, and Coral Gables Senior High School.
Ownership History
Date
Name
Owned For
Owner Type
Purchase Details
Closed on
Dec 22, 2004
Sold by
Angelo Edward and Angelo Constance
Bought by
Angelo Edward and Angelo Constance
Current Estimated Value
Purchase Details
Closed on
Feb 26, 2004
Sold by
Gonzalez Eduardo and Gonzalez Marina
Bought by
Angelo Edward and Angelo Constance
Purchase Details
Closed on
Nov 6, 2001
Sold by
Rodolfo Gonzalez I
Bought by
Alvarez Jose C
Purchase Details
Closed on
Apr 11, 2000
Sold by
Gonzalez Rodolfo and Carlo Helen
Bought by
Gonzalez Eduardo and Gonzalez Marina
Purchase Details
Closed on
Dec 19, 1996
Sold by
Cartaya Sergio and Peniche Margarita Cartaya
Bought by
Gonzalez Rodolfo
Home Financials for this Owner
Home Financials are based on the most recent Mortgage that was taken out on this home.
Original Mortgage
$120,000
Interest Rate
7.65%
Mortgage Type
New Conventional
Create a Home Valuation Report for This Property
The Home Valuation Report is an in-depth analysis detailing your home's value as well as a comparison with similar homes in the area
Home Values in the Area
Average Home Value in this Area
Purchase History
| Date | Buyer | Sale Price | Title Company |
|---|---|---|---|
| Angelo Edward | -- | -- | |
| Angelo Edward | $425,000 | -- | |
| Alvarez Jose C | $130,000 | -- | |
| Gonzalez Eduardo | $243,000 | -- | |
| Gonzalez Rodolfo | $191,000 | -- |
Source: Public Records
Mortgage History
| Date | Status | Borrower | Loan Amount |
|---|---|---|---|
| Previous Owner | Gonzalez Rodolfo | $120,000 |
Source: Public Records
Tax History Compared to Growth
Tax History
| Year | Tax Paid | Tax Assessment Tax Assessment Total Assessment is a certain percentage of the fair market value that is determined by local assessors to be the total taxable value of land and additions on the property. | Land | Improvement |
|---|---|---|---|---|
| 2025 | $12,135 | $895,901 | $702,000 | $193,901 |
| 2024 | $10,931 | $578,164 | -- | -- |
| 2023 | $10,931 | $525,604 | $0 | $0 |
| 2022 | $9,305 | $477,822 | $0 | $0 |
| 2021 | $8,243 | $434,384 | $283,342 | $151,042 |
| 2020 | $8,033 | $422,032 | $269,850 | $152,182 |
| 2019 | $8,075 | $423,184 | $269,850 | $153,334 |
| 2018 | $8,509 | $456,773 | $302,286 | $154,487 |
| 2017 | $8,203 | $434,634 | $0 | $0 |
| 2016 | $8,575 | $410,423 | $0 | $0 |
| 2015 | $7,694 | $378,199 | $0 | $0 |
| 2014 | $6,906 | $343,818 | $0 | $0 |
Source: Public Records
Map
Nearby Homes
- 1501 Algardi Ave
- 4241 S Red Rd
- 1543 Dorado Ave
- 1255 Algardi Ave
- 4144 Pinta Ct
- 1535 Mercado Ave
- 5864 SW 42nd Terrace
- 4310 Santa Maria St
- 5701 SW 33rd St
- 1512 San Rafael Ave
- 1511 Alegriano Ave
- 4001 Santa Maria St
- 3965 SW 60th Ct
- 1360 Mendavia Ave
- 5900 SW 34th St
- 1171 Tiara Ct
- 1435 Blue Rd
- 5912 SW 33rd St
- 3925 SW 61st Ave
- 3911 SW 61st Ave
- 4011 Alhambra Cir
- 4031 Alhambra Cir
- 4005 Alhambra Cir
- 1435 Algardi Ave
- 1434 Bird Rd
- 4012 Alhambra Cir
- 4101 Alhambra Cir
- 4000 Alhambra Cir
- 1427 Algardi Ave
- 1428 Algardi Ave
- 1430 Bird Rd
- 1507 Algardi Ave
- 1506 Bird Rd
- 1424 Algardi Ave
- 3971 Alhambra Cir
- 4111 Alhambra Cir
- 4102 Alhambra Cir
- 1455 Bird Rd
- 1511 Algardi Ave
- 1417 Algardi Ave