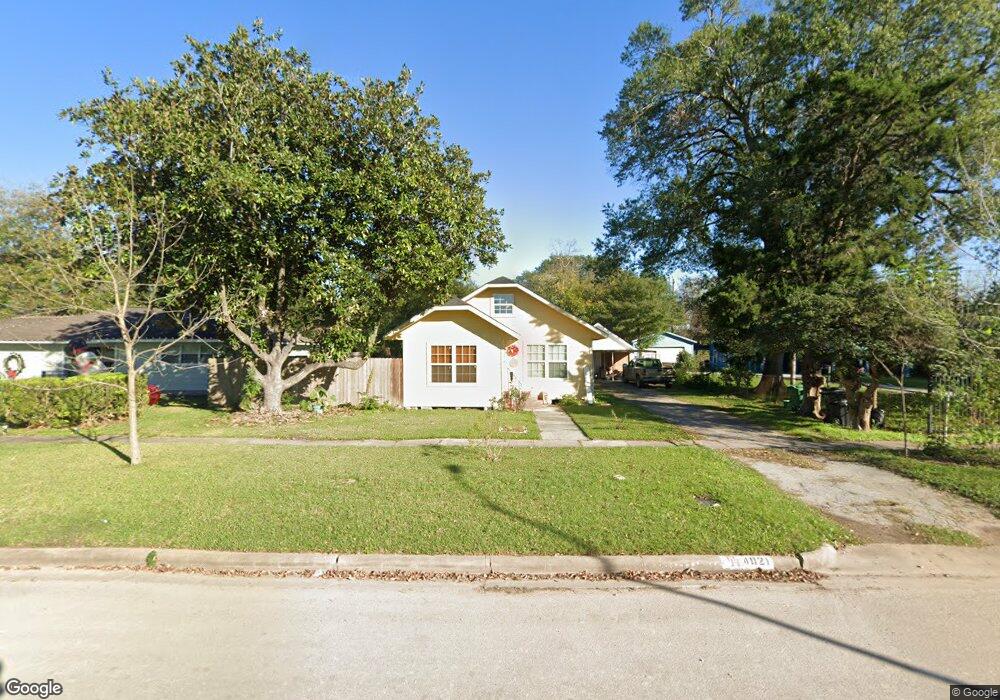
4021 Dover St Houston, TX 77087
Golfcrest-Bellfort-Reveille NeighborhoodEstimated Value: $184,089 - $214,000
2
Beds
1
Bath
1,104
Sq Ft
$180/Sq Ft
Est. Value
About This Home
This home is located at 4021 Dover St, Houston, TX 77087 and is currently estimated at $198,272, approximately $179 per square foot. 4021 Dover St is a home located in Harris County with nearby schools including Park Place Elementary School, Daniel Ortiz Middle School, and Chavez High School.
Ownership History
Date
Name
Owned For
Owner Type
Purchase Details
Closed on
Jan 9, 2015
Sold by
Blanco Alfredo
Bought by
Blanco Alfredo and Cruz Isabella
Current Estimated Value
Home Financials for this Owner
Home Financials are based on the most recent Mortgage that was taken out on this home.
Original Mortgage
$70,500
Outstanding Balance
$24,778
Interest Rate
3.93%
Mortgage Type
New Conventional
Estimated Equity
$173,494
Purchase Details
Closed on
Oct 18, 2004
Sold by
Luedecke Leona E
Bought by
Blanco Alfredo
Home Financials for this Owner
Home Financials are based on the most recent Mortgage that was taken out on this home.
Original Mortgage
$72,000
Interest Rate
9.05%
Mortgage Type
Purchase Money Mortgage
Purchase Details
Closed on
Feb 25, 1998
Sold by
Ralls Kathleen E
Bought by
Heldring Olga M
Home Financials for this Owner
Home Financials are based on the most recent Mortgage that was taken out on this home.
Original Mortgage
$80,000
Interest Rate
7.01%
Create a Home Valuation Report for This Property
The Home Valuation Report is an in-depth analysis detailing your home's value as well as a comparison with similar homes in the area
Home Values in the Area
Average Home Value in this Area
Purchase History
| Date | Buyer | Sale Price | Title Company |
|---|---|---|---|
| Blanco Alfredo | -- | None Available | |
| Blanco Alfredo | -- | Stewart Title Houston Div | |
| Heldring Olga M | -- | Stewart Title Company |
Source: Public Records
Mortgage History
| Date | Status | Borrower | Loan Amount |
|---|---|---|---|
| Open | Blanco Alfredo | $70,500 | |
| Previous Owner | Blanco Alfredo | $72,000 | |
| Previous Owner | Heldring Olga M | $80,000 |
Source: Public Records
Tax History Compared to Growth
Tax History
| Year | Tax Paid | Tax Assessment Tax Assessment Total Assessment is a certain percentage of the fair market value that is determined by local assessors to be the total taxable value of land and additions on the property. | Land | Improvement |
|---|---|---|---|---|
| 2025 | $3,365 | $160,833 | $64,500 | $96,333 |
| 2024 | $3,365 | $160,833 | $64,500 | $96,333 |
| 2023 | $3,365 | $158,122 | $64,500 | $93,622 |
| 2022 | $3,349 | $152,074 | $64,500 | $87,574 |
| 2021 | $3,175 | $136,227 | $45,150 | $91,077 |
| 2020 | $2,308 | $95,321 | $36,120 | $59,201 |
| 2019 | $2,356 | $93,111 | $36,120 | $56,991 |
| 2018 | $2,356 | $93,111 | $36,120 | $56,991 |
| 2017 | $2,354 | $93,111 | $36,120 | $56,991 |
| 2016 | $2,232 | $88,281 | $36,120 | $52,161 |
| 2015 | $2,037 | $79,238 | $36,120 | $43,118 |
| 2014 | $2,037 | $79,238 | $36,120 | $43,118 |
Source: Public Records
Map
Nearby Homes
- 7909 Dixie Dr
- 0 Dover St Unit 39828065
- 7758 Hereford St
- 7734 El Rancho St
- 7735 Oak Vista St
- 8124 Glenbrook Dr
- 8135 Glenbrook Dr
- 3743 Erie St
- 7802 Santa Elena St
- 3727 Broadway St
- 7846 Santa Elena St
- 7936 Grove Ridge Dr
- 7908 Grove Ridge Dr
- 7954 Grove Ridge Dr
- 3607 De Leon St
- 7837 Leonora St
- 7819 Leonora St
- 7916 Glenview Dr
- 8235 Dover St
- 8200 Broadway St Unit 311