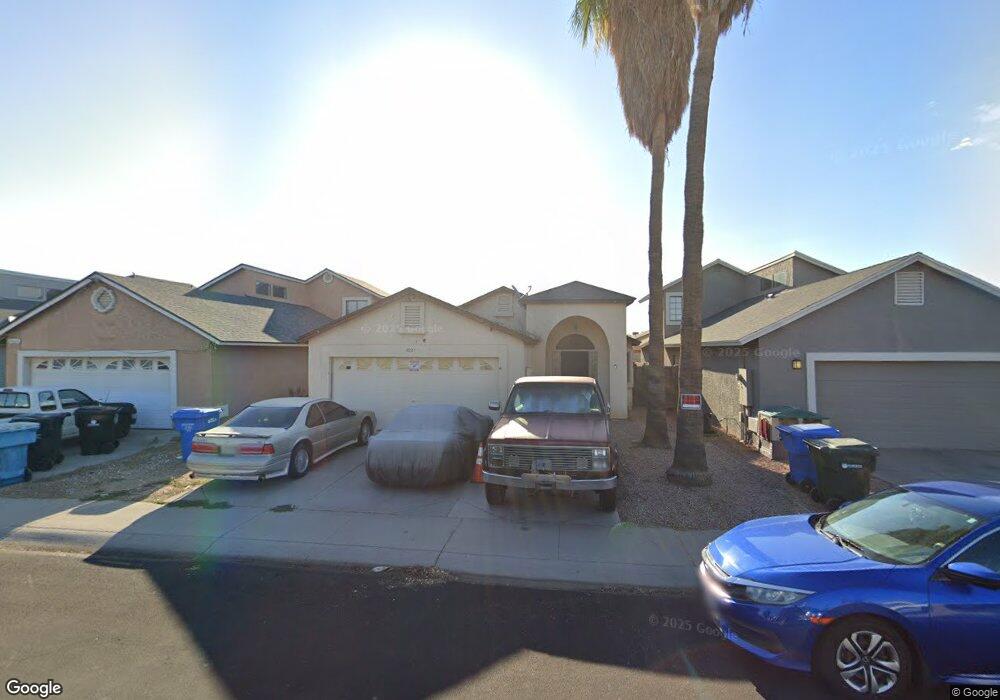
4021 N 89th Ave Phoenix, AZ 85037
Estimated Value: $290,420 - $338,000
Studio
--
Bath
1,258
Sq Ft
$257/Sq Ft
Est. Value
About This Home
This home is located at 4021 N 89th Ave, Phoenix, AZ 85037 and is currently estimated at $323,855, approximately $257 per square foot. 4021 N 89th Ave is a home with nearby schools including Pendergast Elementary School, Copper Canyon High School, and Acclaim Academy.
Ownership History
Date
Name
Owned For
Owner Type
Purchase Details
Closed on
Apr 6, 2007
Sold by
Dini Gloria A
Bought by
Simonds Roger M
Current Estimated Value
Create a Home Valuation Report for This Property
The Home Valuation Report is an in-depth analysis detailing your home's value as well as a comparison with similar homes in the area
Purchase History
| Date | Buyer | Sale Price | Title Company |
|---|---|---|---|
| Simonds Roger M | $95,000 | None Available |
Source: Public Records
Tax History
| Year | Tax Paid | Tax Assessment Tax Assessment Total Assessment is a certain percentage of the fair market value that is determined by local assessors to be the total taxable value of land and additions on the property. | Land | Improvement |
|---|---|---|---|---|
| 2025 | $1,003 | $6,863 | -- | -- |
| 2024 | $953 | $6,863 | -- | -- |
| 2023 | $953 | $22,380 | $4,470 | $17,910 |
| 2022 | $915 | $16,980 | $3,390 | $13,590 |
| 2021 | $879 | $15,400 | $3,080 | $12,320 |
| 2020 | $853 | $14,100 | $2,820 | $11,280 |
| 2019 | $847 | $12,430 | $2,480 | $9,950 |
| 2018 | $795 | $11,710 | $2,340 | $9,370 |
| 2017 | $741 | $10,120 | $2,020 | $8,100 |
| 2016 | $679 | $8,820 | $1,760 | $7,060 |
| 2015 | $660 | $7,780 | $1,550 | $6,230 |
Source: Public Records
Map
Nearby Homes
- 4006 N 88th Ln
- 8926 W Vale Dr
- 4119 N 88th Ave
- 3607 N 90th Ave
- 8819 W Glenrosa Ave
- 3620 N 90th Dr
- 8834 W Osborn Rd
- 8531 W Vale Dr
- 8652 W Heatherbrae Dr
- 3630 N 86th Ave
- 8930 W Montecito Ave
- 8533 W Indianola Ave
- 8733 W Turney Ave
- 8524 W Weldon Ave
- 8933 W Roma Ave
- 9021 W Mulberry Dr
- 8827 W Sells Dr
- 3109 N 89th Dr Unit 1
- 3470 N 98th Ln
- 9132 W Roma Ave
- 4017 N 89th Ave
- 4025 N 89th Ave
- 4029 N 89th Ave
- 4015 N 88th Ln
- 4022 N 88th Ln
- 4018 N 88th Ln
- 4026 N 88th Ln
- 4013 N 89th Ave
- 4030 N 88th Ln
- 4030 N 88th Ln
- 4014 N 88th Dr Unit 109
- 4014 N 88th Ln
- 4014 N 88th Dr
- 4022 N 89th Ave
- 8853 W Vale Dr
- 8849 W Vale Dr
- 4026 N 89th Ave
- 4012 N 88th Dr
- 4018 N 89th Ave
- 4009 N 88th Ln
Your Personal Tour Guide
Ask me questions while you tour the home.