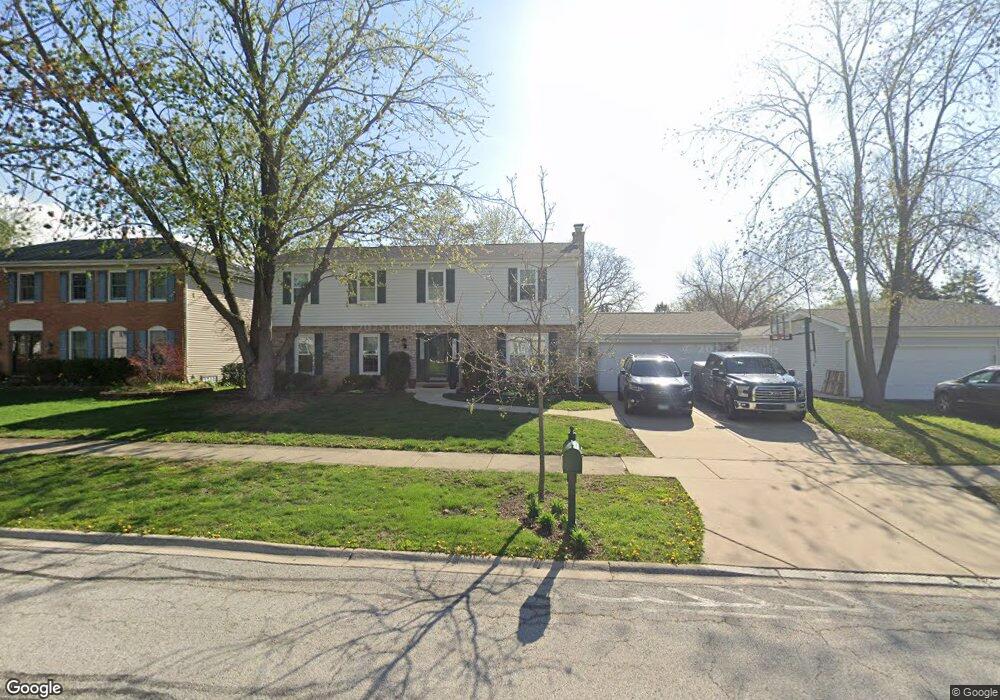
4021 Roslyn Rd Downers Grove, IL 60515
North Westmont NeighborhoodEstimated Value: $700,000 - $788,000
5
Beds
3
Baths
3,172
Sq Ft
$233/Sq Ft
Est. Value
About This Home
This home is located at 4021 Roslyn Rd, Downers Grove, IL 60515 and is currently estimated at $739,443, approximately $233 per square foot. 4021 Roslyn Rd is a home located in DuPage County with nearby schools including Highland Elementary School, Herrick Middle School, and Downer Grove North High School.
Ownership History
Date
Name
Owned For
Owner Type
Purchase Details
Closed on
Dec 6, 2023
Sold by
Lisa M Wright Revocable Living Trust
Bought by
Wright Frank M and Wright Lisa M
Current Estimated Value
Purchase Details
Closed on
Jul 19, 2010
Sold by
Gruttadauro Sue and Onewest Bank Fsb
Bought by
Wright Frank and Wright Lisa
Purchase Details
Closed on
Feb 21, 2010
Sold by
Wright Frank and Wright Lisa
Bought by
Wright Frank M and Wright Lisa M
Purchase Details
Closed on
Mar 2, 2007
Sold by
Harris Na
Bought by
Gruttadauro Sue
Purchase Details
Closed on
Dec 3, 2001
Sold by
Gruttadauro Salvatore
Bought by
Harris Trust & Svgs Bank and Trust #L3022
Purchase Details
Closed on
Sep 8, 1995
Sold by
Donarski Robert C and Donarski Sara A
Bought by
Gruttadauro Salvatore A
Home Financials for this Owner
Home Financials are based on the most recent Mortgage that was taken out on this home.
Original Mortgage
$148,000
Interest Rate
7.81%
Create a Home Valuation Report for This Property
The Home Valuation Report is an in-depth analysis detailing your home's value as well as a comparison with similar homes in the area
Home Values in the Area
Average Home Value in this Area
Purchase History
| Date | Buyer | Sale Price | Title Company |
|---|---|---|---|
| Wright Frank M | -- | None Listed On Document | |
| Wright Frank | -- | None Available | |
| Wright Frank M | -- | None Available | |
| Gruttadauro Sue | -- | None Available | |
| Harris Trust & Svgs Bank | -- | -- | |
| Gruttadauro Salvatore A | $185,000 | -- |
Source: Public Records
Mortgage History
| Date | Status | Borrower | Loan Amount |
|---|---|---|---|
| Previous Owner | Gruttadauro Salvatore A | $148,000 |
Source: Public Records
Tax History Compared to Growth
Tax History
| Year | Tax Paid | Tax Assessment Tax Assessment Total Assessment is a certain percentage of the fair market value that is determined by local assessors to be the total taxable value of land and additions on the property. | Land | Improvement |
|---|---|---|---|---|
| 2024 | $11,645 | $211,404 | $63,082 | $148,322 |
| 2023 | $11,077 | $194,340 | $57,990 | $136,350 |
| 2022 | $10,634 | $186,690 | $55,710 | $130,980 |
| 2021 | $9,955 | $184,570 | $55,080 | $129,490 |
| 2020 | $9,772 | $180,920 | $53,990 | $126,930 |
| 2019 | $9,465 | $173,590 | $51,800 | $121,790 |
| 2018 | $9,002 | $163,500 | $51,480 | $112,020 |
| 2017 | $8,718 | $157,330 | $49,540 | $107,790 |
| 2016 | $8,549 | $150,150 | $47,280 | $102,870 |
| 2015 | $6,896 | $141,260 | $44,480 | $96,780 |
| 2014 | $6,567 | $132,870 | $43,250 | $89,620 |
| 2013 | $6,426 | $132,250 | $43,050 | $89,200 |
Source: Public Records
Map
Nearby Homes
- 3916 Liberty Blvd
- 3931 Liberty Blvd
- 3811 N Park St
- 248 41st St
- 4022 N Grant St
- 4218 Florence Ave
- 4010 N Cass Ave
- 4111 Douglas Rd
- 2919 35th St
- 500 N Grant St
- 2605 35th St
- 3910 Sterling Rd
- 4117 Sterling Rd
- 425 Sherman St
- Lot 3910 Sterling Rd
- 3412 Meyers Rd
- 475 N Cass Ave Unit 212
- 3730 Sterling Rd
- 525 36th St
- 505 Lincoln Ave
- 4011 Roslyn Rd
- 4000 Williams St
- 3928 Williams St
- 3930 Williams St
- 4041 Roslyn Rd
- 4001 Roslyn Rd
- 4022 Roslyn Rd
- 4032 Roslyn Rd
- 4012 Roslyn Rd
- 4051 Roslyn Rd
- 3926 Williams St
- 4004 Williams St
- 3941 Roslyn Rd
- 4042 Roslyn Rd
- 4002 Roslyn Rd
- 4008 Williams St
- 3924 Williams St
- 3942 Roslyn Rd
- 4052 Roslyn Rd
- 4061 Roslyn Rd