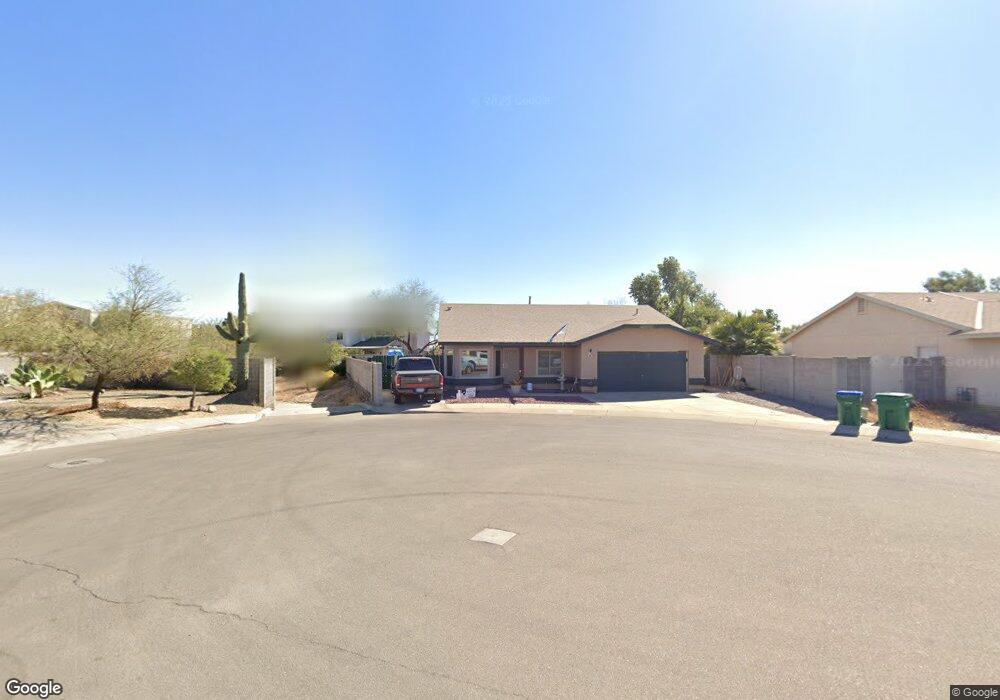
4021 W Sherbrooke Place Tucson, AZ 85742
Estimated Value: $346,000 - $360,000
--
Bed
2
Baths
1,694
Sq Ft
$208/Sq Ft
Est. Value
About This Home
This home is located at 4021 W Sherbrooke Place, Tucson, AZ 85742 and is currently estimated at $351,931, approximately $207 per square foot. 4021 W Sherbrooke Place is a home located in Pima County with nearby schools including Ironwood Elementary School, Tortolita Middle School, and Mountain View High School.
Ownership History
Date
Name
Owned For
Owner Type
Purchase Details
Closed on
Oct 27, 2003
Sold by
Steinhoff Darren and Steinhoff Darren Eric
Bought by
Enriquez Jose D and Robledo Dora Maria
Current Estimated Value
Home Financials for this Owner
Home Financials are based on the most recent Mortgage that was taken out on this home.
Original Mortgage
$148,500
Outstanding Balance
$75,918
Interest Rate
7.5%
Mortgage Type
New Conventional
Estimated Equity
$276,013
Purchase Details
Closed on
Oct 13, 2003
Sold by
Steinhoff Simona Ann and Steinhoff Mona
Bought by
Steinhoff Darren Eric and Steinhoff Darren
Home Financials for this Owner
Home Financials are based on the most recent Mortgage that was taken out on this home.
Original Mortgage
$148,500
Outstanding Balance
$75,918
Interest Rate
7.5%
Mortgage Type
New Conventional
Estimated Equity
$276,013
Purchase Details
Closed on
Jan 27, 2003
Sold by
Steinhoff Jimona Ann
Bought by
Steinhoff Darren Eric
Create a Home Valuation Report for This Property
The Home Valuation Report is an in-depth analysis detailing your home's value as well as a comparison with similar homes in the area
Home Values in the Area
Average Home Value in this Area
Purchase History
| Date | Buyer | Sale Price | Title Company |
|---|---|---|---|
| Enriquez Jose D | $148,500 | -- | |
| Steinhoff Darren Eric | -- | -- | |
| Steinhoff Darren Eric | -- | -- | |
| Steinhoff Darren Eric | -- | -- | |
| Steinhoff Darren Eric | -- | -- |
Source: Public Records
Mortgage History
| Date | Status | Borrower | Loan Amount |
|---|---|---|---|
| Open | Enriquez Jose D | $148,500 |
Source: Public Records
Tax History Compared to Growth
Tax History
| Year | Tax Paid | Tax Assessment Tax Assessment Total Assessment is a certain percentage of the fair market value that is determined by local assessors to be the total taxable value of land and additions on the property. | Land | Improvement |
|---|---|---|---|---|
| 2025 | $2,404 | $18,365 | -- | -- |
| 2024 | $2,404 | $17,490 | -- | -- |
| 2023 | $2,143 | $16,657 | $0 | $0 |
| 2022 | $2,143 | $15,864 | $0 | $0 |
| 2021 | $2,184 | $14,389 | $0 | $0 |
| 2020 | $2,064 | $14,389 | $0 | $0 |
| 2019 | $2,015 | $17,022 | $0 | $0 |
| 2018 | $1,957 | $12,430 | $0 | $0 |
| 2017 | $1,925 | $12,430 | $0 | $0 |
| 2016 | $1,819 | $11,838 | $0 | $0 |
| 2015 | $1,735 | $11,274 | $0 | $0 |
Source: Public Records
Map
Nearby Homes
- 9678 N Sherbrooke St
- 3825 W Perseus St
- 9828 N Pegasus Ave
- 3914 W Cetus St
- 000 W Sumter Dr
- 0 W Sumter Dr Unit 21904702
- 3772 W Desert Totem Ln
- 3856 W Argo St
- 3671 W Flynn Ct
- 3673 W Thundercloud Loop
- 9508 N Flynn Way
- 3552 W Granite Vista Dr
- 3625 W Stony Point Ct
- 3497 W Granite Vista Dr
- 3496 W Granite Vista Dr
- 3517 W Lenihan Ln
- 9890 N Sun Vista Place
- 3615 W Mesa Ridge Trail
- 9300 N Eagle Dancer Dr
- 3579 W Sky Ridge Loop
- 9661 N Gyor Place
- 9686 N Sherbrooke St
- 9660 N Gyor Place
- 4020 W Sherbrooke Place
- 4030 W Sherbrooke Place
- 9651 N Gyor Place
- 9693 N Sherbrooke St
- 9685 N Sherbrooke St
- 9670 N Sherbrooke St
- 9701 N Sherbrooke St
- 9677 N Sherbrooke St
- 9709 N Sherbrooke St
- 9720 N Sherbrooke St
- 9641 N Gyor Place
- 9669 N Sherbrooke St
- 9717 N Sherbrooke St
- 4034 W Lake Echo Rd
- 9640 N Gyor Place
- 9660 N Sherbrooke St
- 4044 W Lake Echo Rd