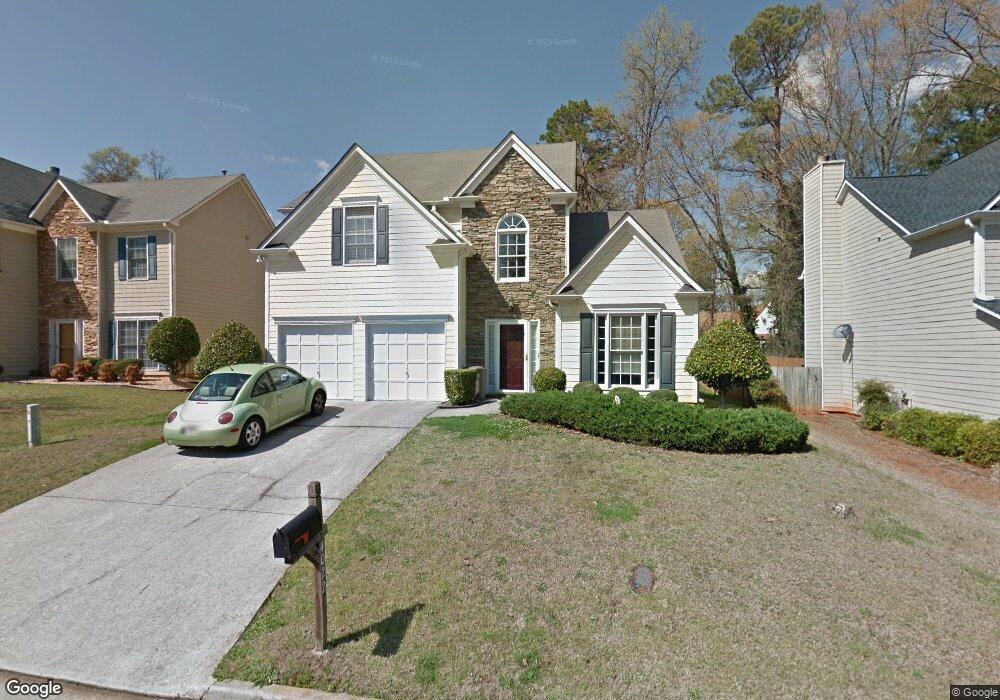
4022 Brockett Walk Unit 187 Tucker, GA 30084
Estimated Value: $411,805 - $453,000
4
Beds
3
Baths
1,910
Sq Ft
$229/Sq Ft
Est. Value
About This Home
This home is located at 4022 Brockett Walk Unit 187, Tucker, GA 30084 and is currently estimated at $437,701, approximately $229 per square foot. 4022 Brockett Walk Unit 187 is a home located in DeKalb County with nearby schools including Brockett Elementary School, Tucker Middle School, and Tucker High School.
Ownership History
Date
Name
Owned For
Owner Type
Purchase Details
Closed on
Jun 23, 2023
Sold by
Xu Xiaowen
Bought by
Tahmina Abdulqudus and Musawer Ahmadi Musawer
Current Estimated Value
Home Financials for this Owner
Home Financials are based on the most recent Mortgage that was taken out on this home.
Original Mortgage
$315,000
Outstanding Balance
$306,850
Interest Rate
6.57%
Mortgage Type
New Conventional
Estimated Equity
$130,851
Purchase Details
Closed on
Jan 14, 2013
Sold by
Pugh Sheila R
Bought by
Xu Xiaowen
Purchase Details
Closed on
Mar 31, 1998
Sold by
Lloyd Robert M and Lloyd Renae C
Bought by
Pugh Shelia R
Home Financials for this Owner
Home Financials are based on the most recent Mortgage that was taken out on this home.
Original Mortgage
$149,150
Interest Rate
6.95%
Mortgage Type
New Conventional
Purchase Details
Closed on
Feb 27, 1997
Sold by
Whitehalld Homes Inc
Bought by
Lloyd Robert M Renae C
Create a Home Valuation Report for This Property
The Home Valuation Report is an in-depth analysis detailing your home's value as well as a comparison with similar homes in the area
Home Values in the Area
Average Home Value in this Area
Purchase History
| Date | Buyer | Sale Price | Title Company |
|---|---|---|---|
| Tahmina Abdulqudus | $375,000 | -- | |
| Xu Xiaowen | $185,168 | -- | |
| Pugh Shelia R | $157,000 | -- | |
| Lloyd Robert M Renae C | $144,900 | -- |
Source: Public Records
Mortgage History
| Date | Status | Borrower | Loan Amount |
|---|---|---|---|
| Open | Tahmina Abdulqudus | $315,000 | |
| Previous Owner | Pugh Shelia R | $149,150 | |
| Closed | Lloyd Robert M Renae C | $0 |
Source: Public Records
Tax History Compared to Growth
Tax History
| Year | Tax Paid | Tax Assessment Tax Assessment Total Assessment is a certain percentage of the fair market value that is determined by local assessors to be the total taxable value of land and additions on the property. | Land | Improvement |
|---|---|---|---|---|
| 2025 | $5,519 | $169,040 | $36,000 | $133,040 |
| 2024 | $7,140 | $150,000 | $35,920 | $114,080 |
| 2023 | $7,140 | $146,120 | $36,000 | $110,120 |
| 2022 | $4,243 | $146,480 | $30,000 | $116,480 |
| 2021 | $3,520 | $113,120 | $30,000 | $83,120 |
| 2020 | $3,382 | $108,600 | $21,160 | $87,440 |
| 2019 | $3,352 | $108,760 | $21,160 | $87,600 |
| 2018 | $2,940 | $99,160 | $21,160 | $78,000 |
| 2017 | $3,126 | $90,640 | $21,160 | $69,480 |
| 2016 | $2,904 | $87,360 | $21,160 | $66,200 |
| 2014 | $2,491 | $74,068 | $21,148 | $52,920 |
Source: Public Records
Map
Nearby Homes
- 3962 Brockett Walk
- 2154 Brockett Rd
- 2089 Carthage Rd
- 3944 Woburn Dr Unit 3
- 2215 Nena Way Unit 20
- 2219 Nena Way Unit 22
- 3599 Woodbriar Cir Unit G
- 3599 Woodbriar Cir Unit A
- 3603 Woodbriar Cir Unit M
- 1926 Brocken Way
- 4217 Theresa Ct
- 4257 Freight St
- 2063 Willow Chase Ct
- 3748 Sturbridge Ct
- 2173 Hannah Ln
- 4110 Oak Crest Dr
- 4022 Brockett Walk
- 4028 Brockett Walk
- 4016 Brockett Walk
- 4010 Brockett Walk
- 4004 Brockett Walk
- 4015 Brockett Walk
- 2078 Brockett Rd
- 4007 Brockett Walk
- 3998 Brockett Walk
- 4001 Brockett Walk
- 0 Brockett Walk Unit 8758572
- 0 Brockett Walk Unit 3104285
- 0 Brockett Walk Unit 3230972
- 3992 Brockett Walk
- 2087 Brockett Rd
- 3986 Brockett Walk
- 2056 Brockett Rd
- 2083 Brockett Rd
- 4017 Grantland Dr
- 3989 Brockett Walk