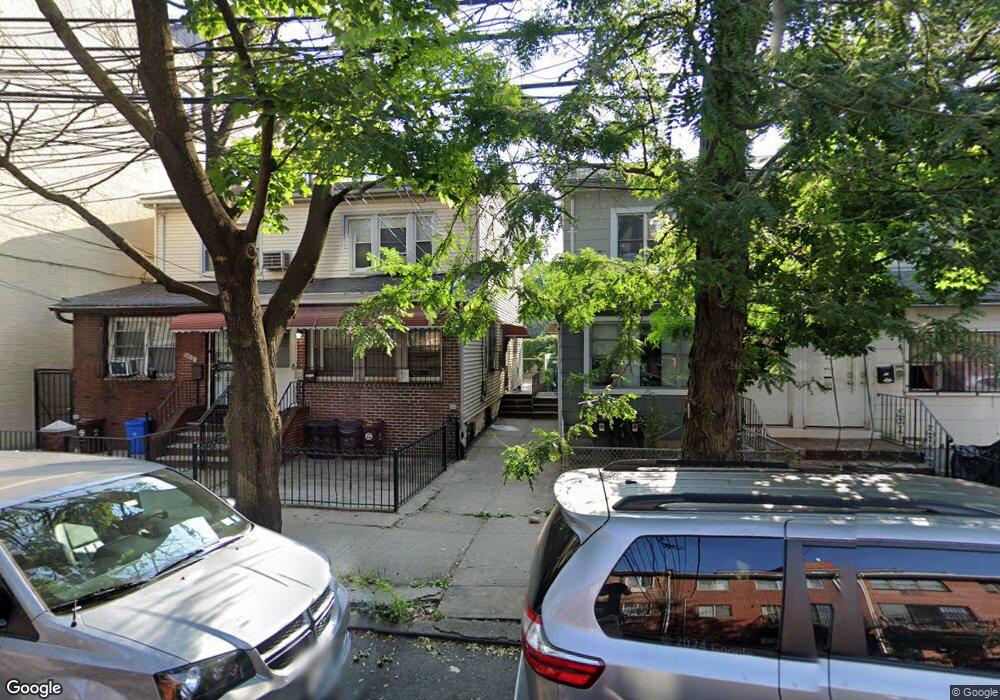
4023 70th St Woodside, NY 11377
Woodside NeighborhoodEstimated Value: $900,983 - $1,223,000
--
Bed
--
Bath
1,409
Sq Ft
$790/Sq Ft
Est. Value
About This Home
This home is located at 4023 70th St, Woodside, NY 11377 and is currently estimated at $1,112,996, approximately $789 per square foot. 4023 70th St is a home located in Queens County with nearby schools including P.S. 12 James B Colgate, William Cullen Bryant High School, and Academy of the City Charter School.
Ownership History
Date
Name
Owned For
Owner Type
Purchase Details
Closed on
Jul 23, 2004
Sold by
Leiter David and Leiter Saila
Bought by
Das Paramita and Das Sanjit
Current Estimated Value
Home Financials for this Owner
Home Financials are based on the most recent Mortgage that was taken out on this home.
Original Mortgage
$105,000
Outstanding Balance
$52,758
Interest Rate
6.2%
Estimated Equity
$1,060,238
Purchase Details
Closed on
Jun 30, 1999
Sold by
Leiter Saila
Bought by
Leiter Saila and Leiter David
Purchase Details
Closed on
Mar 16, 1999
Sold by
Louie Kuen Choon and Louie Yuk Ching
Bought by
Leiter Saila
Home Financials for this Owner
Home Financials are based on the most recent Mortgage that was taken out on this home.
Original Mortgage
$190,800
Interest Rate
7.02%
Create a Home Valuation Report for This Property
The Home Valuation Report is an in-depth analysis detailing your home's value as well as a comparison with similar homes in the area
Home Values in the Area
Average Home Value in this Area
Purchase History
| Date | Buyer | Sale Price | Title Company |
|---|---|---|---|
| Das Paramita | $560,000 | -- | |
| Das Paramita | $560,000 | -- | |
| Leiter Saila | -- | -- | |
| Leiter Saila | -- | -- | |
| Leiter Saila | $212,000 | Stewart Title Insurance Co | |
| Leiter Saila | $212,000 | Stewart Title Insurance Co |
Source: Public Records
Mortgage History
| Date | Status | Borrower | Loan Amount |
|---|---|---|---|
| Open | Das Paramita | $105,000 | |
| Closed | Das Paramita | $105,000 | |
| Previous Owner | Das Paramita | $427,000 | |
| Previous Owner | Leiter Saila | $190,800 |
Source: Public Records
Tax History Compared to Growth
Tax History
| Year | Tax Paid | Tax Assessment Tax Assessment Total Assessment is a certain percentage of the fair market value that is determined by local assessors to be the total taxable value of land and additions on the property. | Land | Improvement |
|---|---|---|---|---|
| 2025 | $7,491 | $40,988 | $12,086 | $28,902 |
| 2024 | $7,503 | $38,695 | $13,677 | $25,018 |
| 2023 | $7,059 | $36,547 | $12,600 | $23,947 |
| 2022 | $6,665 | $57,660 | $19,320 | $38,340 |
| 2021 | $7,033 | $61,680 | $19,320 | $42,360 |
| 2020 | $6,934 | $57,660 | $19,320 | $38,340 |
| 2019 | $6,453 | $52,440 | $19,320 | $33,120 |
| 2018 | $5,911 | $30,456 | $9,596 | $20,860 |
| 2017 | $5,616 | $29,020 | $12,543 | $16,477 |
| 2016 | $5,371 | $29,020 | $12,543 | $16,477 |
| 2015 | $3,082 | $28,464 | $17,360 | $11,104 |
| 2014 | $3,082 | $26,872 | $19,673 | $7,199 |
Source: Public Records
Map
Nearby Homes
- 40-08 69th St
- 40-26 69th St
- 69-22 38th Ave
- 4110 71st St
- 40-40 68th St Unit 1A
- 67-05 Roosevelt Ave
- 4139 70th St
- 41-39 70th St
- 65-22 38th Ave Unit 1A
- 65-15 38th Ave Unit 5 P
- 65-15 38th Ave Unit 2A
- 65-15 38th Ave Unit 5R
- 40 E 73rd St
- 70-35 Broadway Unit D10
- 70-35 Broadway Unit A10
- 7035 Broadway Unit A16
- 40-43 73rd St
- 41-49 71st St
- 38-05 65th St Unit 2F
- 39-43 65th Place
- 4025 70th St
- 4027 70th St
- 4029 70th St
- 4021 70th St
- 4031 70th St
- 4017 70th St
- 4033 70th St
- 40-17 70th St Unit 2
- 40-17 70th St
- 40-17 70th St Unit 3-C
- 40-17 70th St Unit 1D
- 40-17 70th St Unit 4-A
- 40-17 70th St Unit 4-D
- 40-17 70th St Unit 3-A
- 40-17 70th St Unit 2A
- 4035 70th St
- 4015 70th St
- 4035 70th St
- 4035 70th St Unit 3
- 4013 70th St