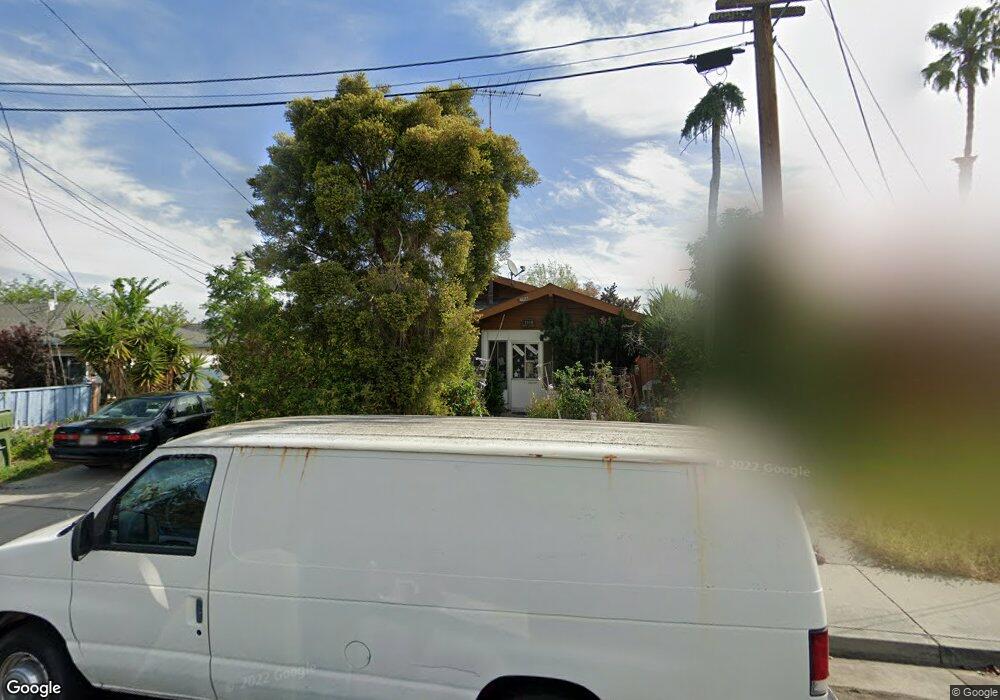
4023 Cheeney St Santa Clara, CA 95054
North Santa Clara NeighborhoodEstimated Value: $1,328,000 - $1,522,613
2
Beds
2
Baths
1,096
Sq Ft
$1,309/Sq Ft
Est. Value
About This Home
This home is located at 4023 Cheeney St, Santa Clara, CA 95054 and is currently estimated at $1,434,903, approximately $1,309 per square foot. 4023 Cheeney St is a home located in Santa Clara County with nearby schools including Kathryn Hughes Elementary School, Buchser Middle School, and Santa Clara High School.
Ownership History
Date
Name
Owned For
Owner Type
Purchase Details
Closed on
Oct 15, 1997
Sold by
Melvin Clark
Bought by
Clark Melvin
Current Estimated Value
Create a Home Valuation Report for This Property
The Home Valuation Report is an in-depth analysis detailing your home's value as well as a comparison with similar homes in the area
Home Values in the Area
Average Home Value in this Area
Purchase History
We collect this data history from publicly available records. To have your information removed, we recommend requesting removal directly through your county’s website.
| Date | Buyer | Sale Price | Title Company |
|---|---|---|---|
| Clark Melvin | -- | -- |
Source: Public Records
Tax History
| Year | Tax Paid | Tax Assessment Tax Assessment Total Assessment is a certain percentage of the fair market value that is determined by local assessors to be the total taxable value of land and additions on the property. | Land | Improvement |
|---|---|---|---|---|
| 2025 | $1,985 | $168,716 | $41,080 | $127,636 |
| 2024 | $1,985 | $165,409 | $40,275 | $125,134 |
| 2023 | $1,985 | $162,167 | $39,486 | $122,681 |
| 2022 | $1,934 | $158,988 | $38,712 | $120,276 |
| 2021 | $1,922 | $155,871 | $37,953 | $117,918 |
| 2020 | $1,886 | $154,273 | $37,564 | $116,709 |
| 2019 | $1,884 | $151,249 | $36,828 | $114,421 |
| 2018 | $1,767 | $148,284 | $36,106 | $112,178 |
| 2017 | $1,755 | $145,378 | $35,399 | $109,979 |
| 2016 | $1,777 | $142,528 | $34,705 | $107,823 |
| 2015 | $1,768 | $140,388 | $34,184 | $106,204 |
| 2014 | $1,667 | $137,639 | $33,515 | $104,124 |
Source: Public Records
Map
Nearby Homes
- 2200 Agnew Rd Unit 210
- 1883 Agnew Rd Unit 311
- 1883 Agnew Rd Unit 254
- 1883 Agnew Rd Unit 420
- 1031 Clyde Ave Unit 1102
- 1680 Shore Place Unit 5
- 4494 Fuller St
- 2368 Sawyer Ct
- 4547 Cheeney St
- 4142 Tobin Cir
- 894 Orkney Ave
- 4189 Marston Ln
- 2207 Gianera St
- 546 Woodstock Way
- 4027 Crandall Cir
- 4298 Watson Cir
- 3766 Pinewood Place
- 4397 Watson Cir
- 579 Moreland Way
- 4010 Fitzpatrick Way
- 4003 Cheeney St
- 4035 Cheeney St
- 1851 Chestnut St
- 4043 Cheeney St
- 4032 Davis St
- 1880 Chestnut St Unit 1
- 1880 Chestnut St
- 1860 Chestnut St
- 4022 Davis St
- 4044 Davis St
- 4042 Davis St
- 1840 Chestnut St
- 1801 Chestnut St
- 4063 Cheeney St
- 1900 Chestnut St
- 4024 Cheeney St
- 1810 Chestnut St
- 4034 Cheeney St
- 4004 Cheeney St
- 4052 Davis St
Your Personal Tour Guide
Ask me questions while you tour the home.