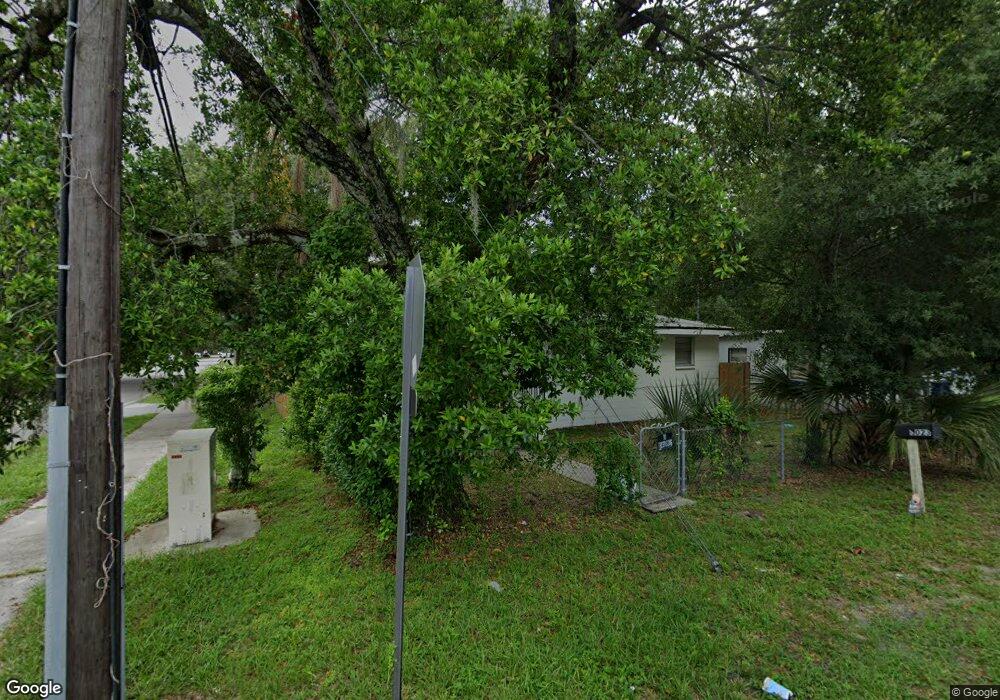
4023 E Henry Ave Tampa, FL 33610
East Lake-Orient Park NeighborhoodEstimated Value: $188,000 - $232,000
2
Beds
1
Bath
880
Sq Ft
$240/Sq Ft
Est. Value
About This Home
This home is located at 4023 E Henry Ave, Tampa, FL 33610 and is currently estimated at $211,188, approximately $239 per square foot. 4023 E Henry Ave is a home located in Hillsborough County with nearby schools including James Elementary School, Jennings Middle School, and Armwood High School.
Ownership History
Date
Name
Owned For
Owner Type
Purchase Details
Closed on
Jan 19, 2022
Sold by
Ben David Tamir and Ben Talia
Bought by
Free Spirit Homes Llc
Current Estimated Value
Purchase Details
Closed on
Nov 29, 2018
Sold by
Superior Real Estate Solutions Llc
Bought by
Ben David Tamir Ben and Ben David Talia
Purchase Details
Closed on
May 28, 2008
Sold by
Hsbc Bank Usa Na
Bought by
Kearney Lee
Purchase Details
Closed on
May 21, 2008
Sold by
Kearney Lee
Bought by
Britt Curtis
Purchase Details
Closed on
Feb 25, 2008
Sold by
Johnson Nathaniel
Bought by
Hsbc Bank Usa Na
Purchase Details
Closed on
Jun 16, 1998
Sold by
Tampa United Methodist Centers Inc
Bought by
Johnson Nathaniel
Create a Home Valuation Report for This Property
The Home Valuation Report is an in-depth analysis detailing your home's value as well as a comparison with similar homes in the area
Home Values in the Area
Average Home Value in this Area
Purchase History
| Date | Buyer | Sale Price | Title Company |
|---|---|---|---|
| Free Spirit Homes Llc | -- | New Title Company Name | |
| Ben David Tamir Ben | $72,000 | Royalty Title Llc | |
| Superior Real Estate Solutions Llc | -- | Royalty Title Llc | |
| Kearney Lee | $38,000 | Attorney | |
| Britt Curtis | $105,000 | Dolphin Title Of Brandon Inc | |
| Hsbc Bank Usa Na | -- | Attorney | |
| Johnson Nathaniel | $53,000 | -- | |
| Free Spirit Homes Llc | -- | New Title Company Name |
Source: Public Records
Mortgage History
| Date | Status | Borrower | Loan Amount |
|---|---|---|---|
| Closed | Johnson Nathaniel | $0 | |
| Closed | Johnson Nathaniel | $25,147 |
Source: Public Records
Tax History Compared to Growth
Tax History
| Year | Tax Paid | Tax Assessment Tax Assessment Total Assessment is a certain percentage of the fair market value that is determined by local assessors to be the total taxable value of land and additions on the property. | Land | Improvement |
|---|---|---|---|---|
| 2024 | $2,878 | $145,607 | $35,484 | $110,123 |
| 2023 | $2,934 | $147,371 | $35,484 | $111,887 |
| 2022 | $2,000 | $120,223 | $27,295 | $92,928 |
| 2021 | $1,752 | $89,169 | $25,930 | $63,239 |
| 2020 | $1,566 | $73,848 | $13,648 | $60,200 |
| 2019 | $1,660 | $78,236 | $17,742 | $60,494 |
| 2018 | $1,089 | $62,649 | $0 | $0 |
| 2017 | $932 | $46,042 | $0 | $0 |
| 2016 | $834 | $35,594 | $0 | $0 |
| 2015 | $723 | $32,358 | $0 | $0 |
| 2014 | $700 | $32,414 | $0 | $0 |
| 2013 | -- | $29,657 | $0 | $0 |
Source: Public Records
Map
Nearby Homes
- 4207 E Henry Ave
- 4304 Deleuil Ave
- 4015 E Idlewild Ave
- 6415 N 40th St
- 6443 N 40th St
- 4310 E Clifton St
- 4207 E Paris St
- 4102 E Hanna Ave
- 3722 E Idlewild Ave
- 3717 E Clifton St
- 3713 E Clifton St
- 5501 N 37th St
- 4507 E Giddens Ave
- 3632 E Comanche Ave
- 5202 N 45th St
- 6001 N 48th St
- 5105 N 45th St
- 3425 E Powhatan Ave
- 3422 E Powhatan Ave
- 3415 Deleuil Ave
- 4021 E Henry Ave
- 4019 E Henry Ave
- 4201 E Henry Ave
- 4022 E Powhatan Ave
- 4018 E Powhatan Ave
- 4016 E Powhatan Ave
- 4200 E Powhatan Ave
- 4017 E Henry Ave
- 4203 E Henry Ave
- 4022 E Henry Ave
- 4018 E Henry Ave
- 4014 E Powhatan Ave
- 4202 E Powhatan Ave
- 4015 E Henry Ave
- 4202 E Henry Ave
- 4012 E Powhatan Ave
- 4016 E Henry Ave
- 4204 E Powhatan Ave
- 4013 E Henry Ave
- 4204 E Henry Ave