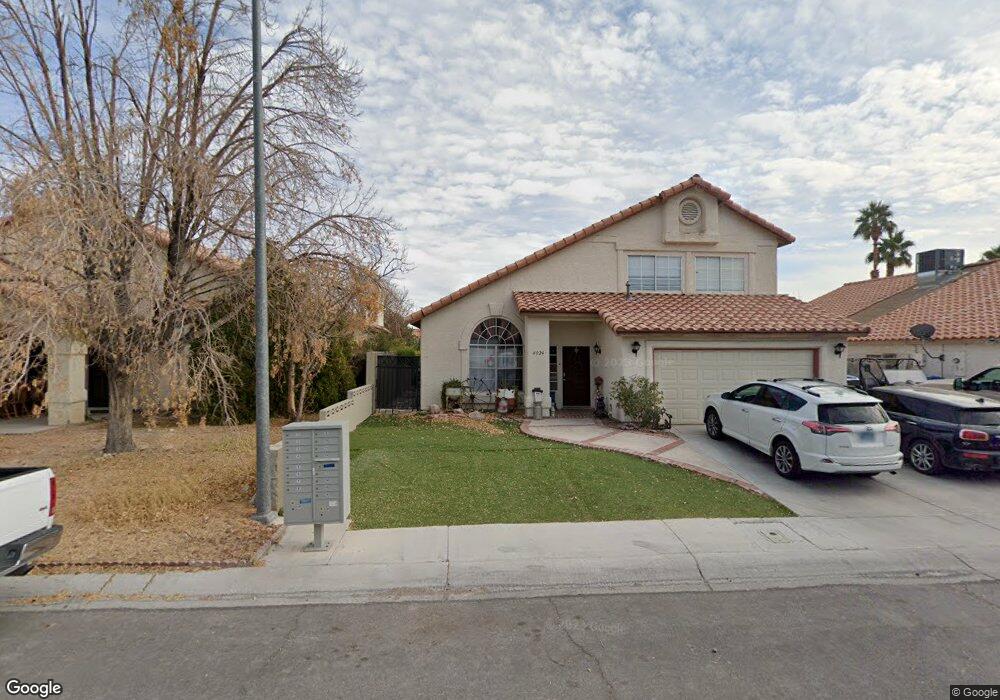
4024 Dove Creek Rd North Las Vegas, NV 89032
Cheyenne NeighborhoodEstimated Value: $287,000 - $475,000
4
Beds
3
Baths
1,965
Sq Ft
$190/Sq Ft
Est. Value
About This Home
This home is located at 4024 Dove Creek Rd, North Las Vegas, NV 89032 and is currently estimated at $374,127, approximately $190 per square foot. 4024 Dove Creek Rd is a home located in Clark County with nearby schools including Claude & Stella Parson Elementary School, Theron L Swainston Middle School, and Cheyenne High School.
Ownership History
Date
Name
Owned For
Owner Type
Purchase Details
Closed on
May 13, 2025
Sold by
St Llc
Bought by
Lasike Salesi and Lasike Tresa
Current Estimated Value
Purchase Details
Closed on
Aug 2, 2013
Sold by
Lasike 10 Llc
Bought by
St Llc
Purchase Details
Closed on
Jun 4, 2012
Sold by
Ls Lt Llc
Bought by
Lasike 10 Llc
Purchase Details
Closed on
Jul 6, 2005
Sold by
Lasike Salesi and Lasike Tresa V
Bought by
Ls Lt Llc
Purchase Details
Closed on
Dec 28, 2000
Sold by
Lasike Salesi
Bought by
Lasike Salesi and Lasike Tresa
Purchase Details
Closed on
Jan 18, 2000
Sold by
Lasike Tresa
Bought by
Lasike Salesi
Home Financials for this Owner
Home Financials are based on the most recent Mortgage that was taken out on this home.
Original Mortgage
$135,218
Interest Rate
7.84%
Purchase Details
Closed on
Nov 13, 1999
Sold by
Johnson Gregory B and Johnson Linnea G
Bought by
Lasike Salesi
Create a Home Valuation Report for This Property
The Home Valuation Report is an in-depth analysis detailing your home's value as well as a comparison with similar homes in the area
Home Values in the Area
Average Home Value in this Area
Purchase History
| Date | Buyer | Sale Price | Title Company |
|---|---|---|---|
| Lasike Salesi | $168,011 | Chicago Title | |
| Lasike Salesi | $286,963 | Chicago Title | |
| St Llc | -- | None Available | |
| Lasike 10 Llc | -- | None Available | |
| Ls Lt Llc | -- | -- | |
| Lasike Salesi | -- | -- | |
| Lasike Salesi | -- | Old Republic Title Company | |
| Lasike Salesi | $139,400 | Old Republic Title Company |
Source: Public Records
Mortgage History
| Date | Status | Borrower | Loan Amount |
|---|---|---|---|
| Previous Owner | Lasike Salesi | $135,218 |
Source: Public Records
Tax History Compared to Growth
Tax History
| Year | Tax Paid | Tax Assessment Tax Assessment Total Assessment is a certain percentage of the fair market value that is determined by local assessors to be the total taxable value of land and additions on the property. | Land | Improvement |
|---|---|---|---|---|
| 2025 | $2,017 | $100,086 | $31,850 | $68,236 |
| 2024 | $1,959 | $100,086 | $31,850 | $68,236 |
| 2023 | $1,959 | $95,912 | $30,800 | $65,112 |
| 2022 | $1,902 | $85,828 | $25,550 | $60,278 |
| 2021 | $1,847 | $82,487 | $24,850 | $57,637 |
| 2020 | $1,790 | $79,965 | $22,400 | $57,565 |
| 2019 | $1,738 | $76,829 | $19,950 | $56,879 |
| 2018 | $1,687 | $71,804 | $16,800 | $55,004 |
| 2017 | $2,377 | $70,865 | $14,700 | $56,165 |
| 2016 | $1,598 | $63,422 | $10,850 | $52,572 |
| 2015 | $1,594 | $48,140 | $7,000 | $41,140 |
| 2014 | $1,545 | $46,308 | $7,000 | $39,308 |
Source: Public Records
Map
Nearby Homes
- 4335 Twin Peaks Dr
- 4108 Dove Creek Rd
- 4115 Tatum Ct
- 4230 Valley Spruce Way
- 3938 Redfield Ave
- 3830 Passionfruit St
- 4013 Extenso Dr
- 4508 W San Miguel Ave
- 3904 Six Gun Rd
- 4002 Extenso Dr
- 4524 Denali Ave
- 3784 Nerine Pass Way
- 3928 Biddle St
- 4341 San Mateo St
- 3937 Jamison Park Ln
- 4076 Topaz Hills Dr
- 4216 N Decatur Blvd
- 3930 Burma Rd
- 3816 Sunking St
- 3820 Alpine Track Ave
- 4028 Dove Creek Rd
- 4020 Dove Creek Rd
- 4032 Dove Creek Rd
- 4016 Dove Creek Rd
- 4025 Dove Creek Rd
- 4021 Dove Creek Rd
- 4029 Dove Creek Rd
- 4036 Dove Creek Rd
- 4025 Stockman St
- 4012 Dove Creek Rd
- 4029 Stockman St
- 4021 Stockman St
- 4320 Twin Peaks Dr Unit 3
- 4033 Stockman St
- 4319 Peaceful Path Ct
- 4017 Stockman St
- 4040 Dove Creek Rd
- 4037 Stockman St
- 4013 Stockman St
- 4323 Peaceful Path Ct