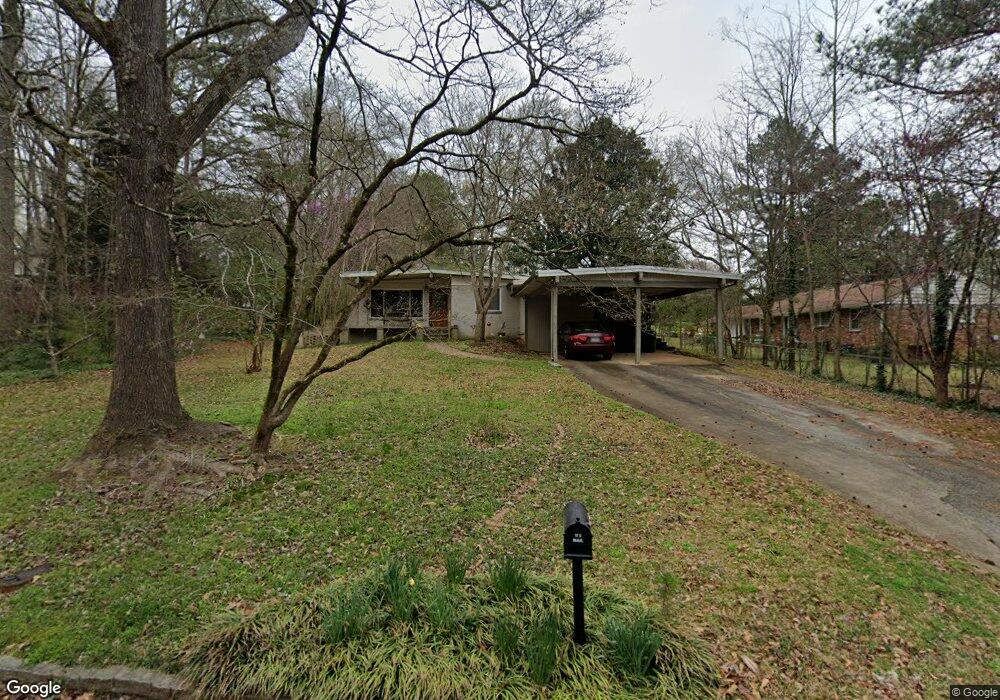
4024 Laynewood Cir Tucker, GA 30084
Pittsburg NeighborhoodEstimated Value: $334,000 - $435,000
3
Beds
2
Baths
1,585
Sq Ft
$232/Sq Ft
Est. Value
About This Home
This home is located at 4024 Laynewood Cir, Tucker, GA 30084 and is currently estimated at $368,437, approximately $232 per square foot. 4024 Laynewood Cir is a home located in DeKalb County with nearby schools including Livsey Elementary School, Tucker Middle School, and Tucker High School.
Ownership History
Date
Name
Owned For
Owner Type
Purchase Details
Closed on
Aug 14, 2019
Sold by
Taylor Dean F
Bought by
Taylor Patricia A
Current Estimated Value
Purchase Details
Closed on
Jun 21, 2002
Sold by
Taylor Patricia
Bought by
Taylor Patricia and Taylor Dean
Home Financials for this Owner
Home Financials are based on the most recent Mortgage that was taken out on this home.
Original Mortgage
$142,400
Interest Rate
5.92%
Mortgage Type
New Conventional
Create a Home Valuation Report for This Property
The Home Valuation Report is an in-depth analysis detailing your home's value as well as a comparison with similar homes in the area
Home Values in the Area
Average Home Value in this Area
Purchase History
| Date | Buyer | Sale Price | Title Company |
|---|---|---|---|
| Taylor Patricia A | $200,400 | -- | |
| Taylor Patricia | -- | -- | |
| Taylor Patrici | $178,000 | -- |
Source: Public Records
Mortgage History
| Date | Status | Borrower | Loan Amount |
|---|---|---|---|
| Previous Owner | Taylor Patrici | $142,400 |
Source: Public Records
Tax History Compared to Growth
Tax History
| Year | Tax Paid | Tax Assessment Tax Assessment Total Assessment is a certain percentage of the fair market value that is determined by local assessors to be the total taxable value of land and additions on the property. | Land | Improvement |
|---|---|---|---|---|
| 2025 | $3,790 | $135,680 | $26,320 | $109,360 |
| 2024 | $3,773 | $130,880 | $26,320 | $104,560 |
| 2023 | $3,773 | $125,160 | $26,320 | $98,840 |
| 2022 | $2,987 | $99,240 | $26,320 | $72,920 |
| 2021 | $2,738 | $88,480 | $26,320 | $62,160 |
| 2020 | $2,732 | $88,000 | $26,320 | $61,680 |
| 2019 | $2,676 | $86,560 | $26,320 | $60,240 |
| 2018 | $2,389 | $80,160 | $26,320 | $53,840 |
| 2017 | $2,396 | $71,040 | $17,280 | $53,760 |
| 2016 | $2,358 | $71,800 | $17,280 | $54,520 |
| 2014 | $1,244 | $37,440 | $13,400 | $24,040 |
Source: Public Records
Map
Nearby Homes
- 2851 Thornridge Dr
- 3359 Wembley Walk
- 3354 Wembley Walk
- 2817 Thornridge Dr
- 4636 Chamblee Tucker Rd
- 3142 Wanda Woods Dr
- 3160 Shadow Walk Ln
- 3183 Shadow Walk Ln
- 3073 Shadow Walk Ln
- 2752 Arldowne Dr
- 2956 Briarglen Dr
- 4276 Smithsonia Dr
- 2656 Lake Erin Dr Unit 3
- 225 Bentley Place
- 4125 Spring Valley Cir Unit 7
- 533 Bentley Place
- 328 Bentley Place
- 3211 Olde Dekalb Way
- 434 Bentley Place
- 3274 Enfield Ct
- 4063 Menlo Dr
- 4054 Laynewood Cir
- 4066 Laynewood Cir
- 4073 Menlo Dr
- 4076 Laynewood Cir
- 4019 Laynewood Cir
- 4029 Laynewood Cir
- 4062 Menlo Dr
- 4037 Laynewood Cir
- 4055 Laynewood Cir
- 4063 Laynewood Cir
- 4070 Menlo Dr
- 4052 Menlo Dr
- 4084 Laynewood Cir Unit 2
- 4049 Laynewood Cir
- 4043 Laynewood Cir Unit 2
- 4071 Laynewood Cir
- 4078 Menlo Dr
- 2991 Thornbriar Rd
- 4079 Laynewood Cir