Estimated Value: $303,000 - $369,000
3
Beds
2
Baths
2,016
Sq Ft
$165/Sq Ft
Est. Value
About This Home
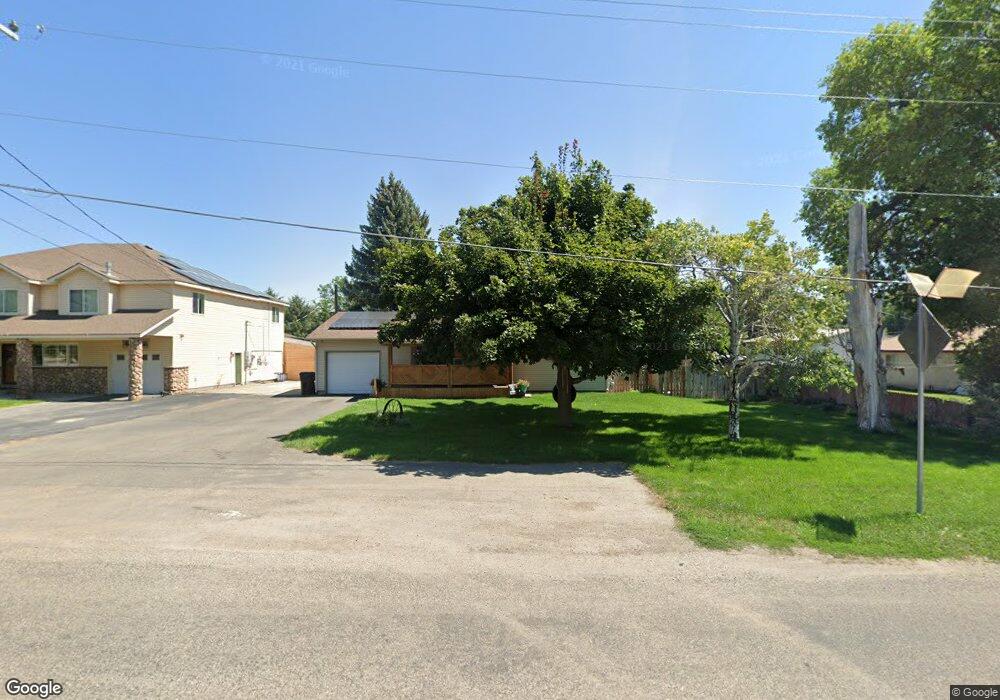
This home is located at 4024 Olsen St, Iona, ID 83427 and is currently estimated at $332,832, approximately $165 per square foot. 4024 Olsen St is a home located in Bonneville County with nearby schools including Iona Elementary School, Rocky Mountain Middle School, and Bonneville High School.
Ownership History
Date
Name
Owned For
Owner Type
Purchase Details
Closed on
Jul 23, 2019
Sold by
Dixon Devin M and Dixon Shyla
Bought by
Dixon Shyla
Current Estimated Value
Purchase Details
Closed on
Jan 7, 2010
Sold by
Us Bank National Assocation
Bought by
Dixon Devin M and Dixon Shyla
Home Financials for this Owner
Home Financials are based on the most recent Mortgage that was taken out on this home.
Original Mortgage
$198,697
Outstanding Balance
$128,657
Interest Rate
4.68%
Mortgage Type
FHA
Estimated Equity
$204,175
Purchase Details
Closed on
Sep 29, 2009
Sold by
Deringer Steele D and Deringer Leah A
Bought by
Sg Mortgage Securities
Purchase Details
Closed on
Apr 28, 2006
Sold by
Porter Brian C and Porter Jana L
Bought by
Deringer Steele D and Deringer Leah A
Home Financials for this Owner
Home Financials are based on the most recent Mortgage that was taken out on this home.
Original Mortgage
$25,000
Interest Rate
6.3%
Mortgage Type
New Conventional
Create a Home Valuation Report for This Property
The Home Valuation Report is an in-depth analysis detailing your home's value as well as a comparison with similar homes in the area
Home Values in the Area
Average Home Value in this Area
Purchase History
| Date | Buyer | Sale Price | Title Company |
|---|---|---|---|
| Dixon Shyla | -- | Accommodation | |
| Dixon Devin M | -- | -- | |
| Sg Mortgage Securities | $106,675 | -- | |
| Deringer Steele D | -- | First American Title Co |
Source: Public Records
Mortgage History
| Date | Status | Borrower | Loan Amount |
|---|---|---|---|
| Open | Dixon Devin M | $198,697 | |
| Previous Owner | Deringer Steele D | $25,000 | |
| Previous Owner | Deringer Steele D | $100,000 |
Source: Public Records
Tax History Compared to Growth
Tax History
| Year | Tax Paid | Tax Assessment Tax Assessment Total Assessment is a certain percentage of the fair market value that is determined by local assessors to be the total taxable value of land and additions on the property. | Land | Improvement |
|---|---|---|---|---|
| 2025 | $967 | $374,734 | $88,542 | $286,192 |
| 2024 | $967 | $308,554 | $57,977 | $250,577 |
| 2023 | $851 | $238,637 | $57,977 | $180,660 |
| 2022 | $1,136 | $240,508 | $50,398 | $190,110 |
| 2021 | $1,031 | $173,408 | $50,398 | $123,010 |
| 2019 | $1,063 | $137,388 | $37,058 | $100,330 |
| 2018 | $983 | $133,423 | $33,693 | $99,730 |
| 2017 | $942 | $118,124 | $28,074 | $90,050 |
| 2016 | $950 | $111,864 | $28,074 | $83,790 |
| 2015 | $930 | $110,179 | $26,669 | $83,510 |
| 2014 | $9,577 | $110,179 | $26,669 | $83,510 |
| 2013 | $971 | $111,158 | $26,668 | $84,490 |
Source: Public Records
Map
Nearby Homes
- 5153 E Demott St
- 5160 E Hansen Ave
- 4777 E Miles Dr
- 3603 N Elim Ln
- The Scotty Plan at Elim Estates
- The Dornie Plan at Elim Estates
- The Halkirk Plan at Elim Estates
- The William Plan at Elim Estates
- The Montgomery Plan at Elim Estates
- TBD Tbd
- 5311 E Dutson
- 4887 N Sunset Dr
- 3142 Quaky Aspen Dr
- 5048 Big River Rd
- 4937 Big River Rd
- 3891 Baldwin Ave
- 4944 Cattle Dr
- 4325 N Livingston Ave
- 4407 E Arcadia Ave
- 4391 E Arcadia Ave
- 4062 Olsen St
- 5117 E Steele Ave
- 5123 E Steele Ave
- 5070 41st St N
- 5071 E Steele Ave
- 5147 E Steele Ave
- 5082 E Demott St
- 5112 E Demott St
- 5114 E Steele Ave
- 5132 Steele Ave
- Lot15 Steele Ave
- 5018 41st St N
- 5148 E Steele Ave
- 3865 Olsen St
- 5013 E Steele Ave
- 5163 E Steele Ave
- 5132 E Demott St
- 5018 Rushton Rd
- 3848 Olsen St
- 5162 E Steele Ave