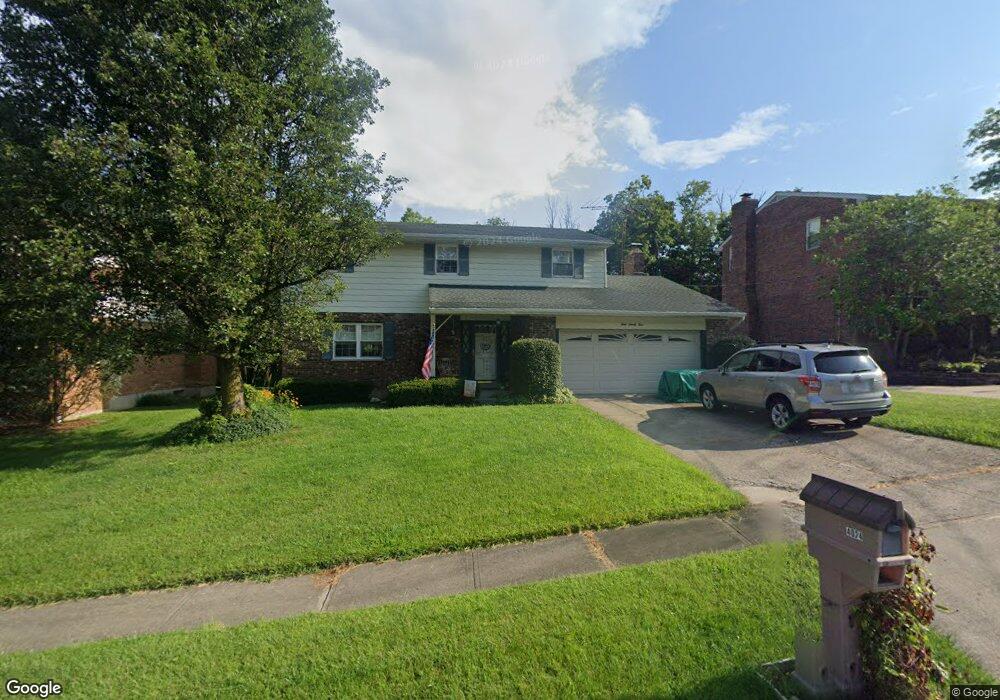
4024 Simca Ln Cincinnati, OH 45211
South Monfort Heights NeighborhoodEstimated Value: $280,000 - $335,000
4
Beds
3
Baths
2,016
Sq Ft
$152/Sq Ft
Est. Value
About This Home
This home is located at 4024 Simca Ln, Cincinnati, OH 45211 and is currently estimated at $306,541, approximately $152 per square foot. 4024 Simca Ln is a home located in Hamilton County with nearby schools including Oakdale Elementary School, Bridgetown Middle School, and Oak Hills High School.
Ownership History
Date
Name
Owned For
Owner Type
Purchase Details
Closed on
Aug 16, 1999
Sold by
Hayden Charles A Trs & Lee N Trs
Bought by
Stgeorge John C and Stgeorge Mary H
Current Estimated Value
Home Financials for this Owner
Home Financials are based on the most recent Mortgage that was taken out on this home.
Original Mortgage
$90,000
Interest Rate
7.61%
Purchase Details
Closed on
Oct 7, 1998
Sold by
Hayden Lee N
Bought by
Hayden Charles A and Hayden Lee N
Create a Home Valuation Report for This Property
The Home Valuation Report is an in-depth analysis detailing your home's value as well as a comparison with similar homes in the area
Home Values in the Area
Average Home Value in this Area
Purchase History
| Date | Buyer | Sale Price | Title Company |
|---|---|---|---|
| Stgeorge John C | $150,000 | -- | |
| Hayden Charles A | -- | -- |
Source: Public Records
Mortgage History
| Date | Status | Borrower | Loan Amount |
|---|---|---|---|
| Closed | Stgeorge John C | $90,000 | |
| Closed | Stgeorge John C | $30,000 |
Source: Public Records
Tax History
| Year | Tax Paid | Tax Assessment Tax Assessment Total Assessment is a certain percentage of the fair market value that is determined by local assessors to be the total taxable value of land and additions on the property. | Land | Improvement |
|---|---|---|---|---|
| 2025 | $4,235 | $81,271 | $11,827 | $69,444 |
| 2023 | $4,133 | $81,271 | $11,827 | $69,444 |
| 2022 | $3,454 | $57,534 | $11,512 | $46,022 |
| 2021 | $3,102 | $57,534 | $11,512 | $46,022 |
| 2020 | $3,142 | $57,534 | $11,512 | $46,022 |
| 2019 | $3,075 | $51,370 | $10,280 | $41,090 |
| 2018 | $3,079 | $51,370 | $10,280 | $41,090 |
| 2017 | $2,903 | $51,370 | $10,280 | $41,090 |
| 2016 | $2,971 | $52,511 | $10,182 | $42,329 |
| 2015 | $2,996 | $52,511 | $10,182 | $42,329 |
| 2014 | $3,000 | $52,511 | $10,182 | $42,329 |
| 2013 | $2,832 | $53,039 | $10,283 | $42,756 |
Source: Public Records
Map
Nearby Homes
- 4109 Janward Dr
- 4166 Janward Dr
- 4403 School Section Rd
- 4105 Trevor Ave
- 4104 Trevor Ave
- 4228 Homelawn Ave
- 3981 School Section Rd
- 3963 School Section Rd
- 3973 School Section Rd
- 3935 Carrie Ave
- 3935 Lovell Ave
- 4052 McFarran Ave
- 3628 Ridgewood Ave
- 4117 N Bend Rd
- 3594 Homelawn Ave
- 3623 Reemelin Rd
- 4163 Harrison Ave
- 3940 Delmar Ave
- 3933 Delmar Ave
- 3939 Davis Ave
Your Personal Tour Guide
Ask me questions while you tour the home.