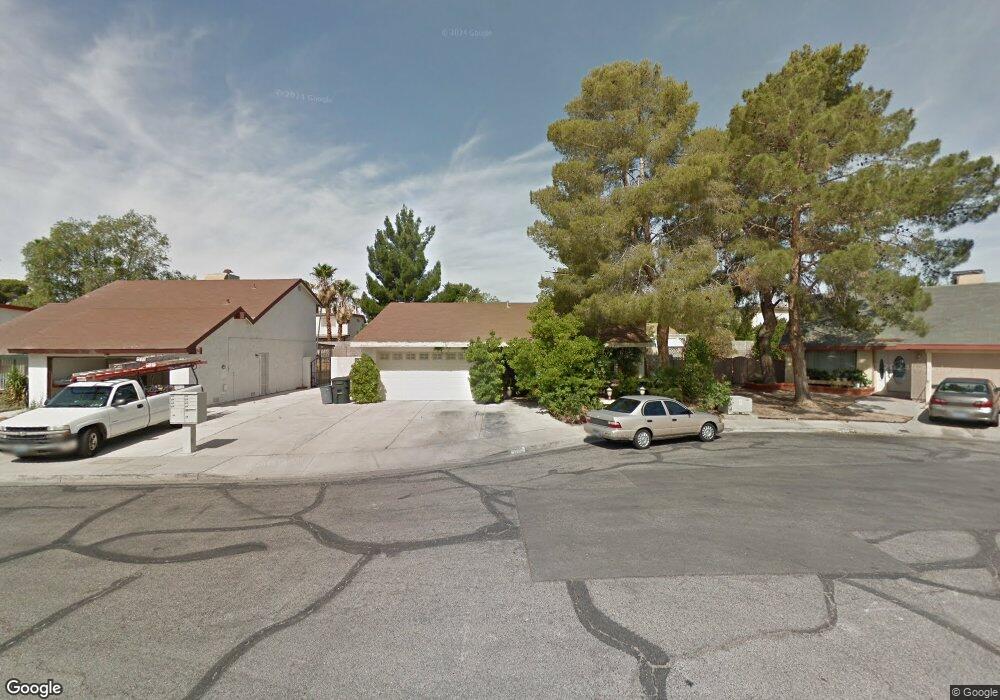
4025 Archcrest Cir Las Vegas, NV 89147
Estimated Value: $371,193 - $399,000
3
Beds
2
Baths
1,202
Sq Ft
$320/Sq Ft
Est. Value
About This Home
This home is located at 4025 Archcrest Cir, Las Vegas, NV 89147 and is currently estimated at $384,298, approximately $319 per square foot. 4025 Archcrest Cir is a home located in Clark County with nearby schools including Pat Diskin Elementary School, Clifford J Lawrence Junior High School, and Spring Valley High School.
Ownership History
Date
Name
Owned For
Owner Type
Purchase Details
Closed on
Mar 27, 2006
Sold by
Banuelos Armando and Razo Irene
Bought by
Perez J Trinidad
Current Estimated Value
Purchase Details
Closed on
Jan 15, 2003
Sold by
Hanson Ken J and Hanson Renee
Bought by
Banuelos Armando and Razo Irene
Home Financials for this Owner
Home Financials are based on the most recent Mortgage that was taken out on this home.
Original Mortgage
$144,212
Interest Rate
5.76%
Mortgage Type
FHA
Purchase Details
Closed on
Apr 8, 1998
Sold by
Parks Howard M and Parks Cindie L
Bought by
Hanson Ken J and Hanson Renee
Home Financials for this Owner
Home Financials are based on the most recent Mortgage that was taken out on this home.
Original Mortgage
$108,855
Interest Rate
7.06%
Create a Home Valuation Report for This Property
The Home Valuation Report is an in-depth analysis detailing your home's value as well as a comparison with similar homes in the area
Home Values in the Area
Average Home Value in this Area
Purchase History
| Date | Buyer | Sale Price | Title Company |
|---|---|---|---|
| Perez J Trinidad | $248,000 | National Title Company | |
| Banuelos Armando | $146,250 | Old Republic Title Company | |
| Hanson Ken J | $110,000 | Fidelity National Title |
Source: Public Records
Mortgage History
| Date | Status | Borrower | Loan Amount |
|---|---|---|---|
| Previous Owner | Banuelos Armando | $144,212 | |
| Previous Owner | Hanson Ken J | $108,855 |
Source: Public Records
Tax History Compared to Growth
Tax History
| Year | Tax Paid | Tax Assessment Tax Assessment Total Assessment is a certain percentage of the fair market value that is determined by local assessors to be the total taxable value of land and additions on the property. | Land | Improvement |
|---|---|---|---|---|
| 2025 | $1,412 | $59,418 | $35,350 | $24,068 |
| 2024 | $1,308 | $59,418 | $35,350 | $24,068 |
| 2023 | $1,308 | $58,978 | $35,000 | $23,978 |
| 2022 | $1,211 | $49,731 | $27,300 | $22,431 |
| 2021 | $1,122 | $45,237 | $23,450 | $21,787 |
| 2020 | $1,039 | $45,454 | $23,450 | $22,004 |
| 2019 | $974 | $43,088 | $21,000 | $22,088 |
| 2018 | $929 | $40,944 | $19,250 | $21,694 |
| 2017 | $1,169 | $39,866 | $17,500 | $22,366 |
| 2016 | $871 | $35,688 | $12,600 | $23,088 |
| 2015 | $868 | $33,647 | $10,500 | $23,147 |
| 2014 | $843 | $27,874 | $8,050 | $19,824 |
Source: Public Records
Map
Nearby Homes
- 7285 Bridgeview Ave
- 7225 Bridgeview Ave
- 3944 Belhaven St
- 7247 Pleasant View Ave
- 7400 W Flamingo Rd Unit 1033
- 7400 W Flamingo Rd Unit 2013
- 7400 W Flamingo Rd Unit 2056
- 7400 W Flamingo Rd Unit 1087
- 7075 Starwood Dr
- 7274 Pinebrook Cir
- 7229 Pinebrook Cir
- 7285 Pinebrook Cir
- 7012 Grassy Knoll St
- 3869 Birchview Ct
- 6969 Grassy Knoll St
- 3957 Laurel Brook Dr
- 3869 Mapleview Ct
- 7130 Wedgewood Way
- 7570 W Flamingo Rd Unit 142
- 6990 Paddington Way
- 4035 Archcrest Cir
- 4026 Bridgeview Cir Unit 7
- 4016 Bridgeview Cir
- 4015 Archcrest Cir
- 4015 Archcrest Cir
- 4036 Bridgeview Cir
- 4045 Archcrest Cir
- 4006 Bridgeview Cir
- 7246 Archcrest Ave
- 4005 Archcrest Cir
- 4046 Bridgeview Cir
- 4014 Archcrest Cir
- 4024 Archcrest Cir
- 3996 Bridgeview Cir
- 7263 Archcrest Ave
- 7236 Archcrest Ave
- 4056 Bridgeview Cir
- 7253 Archcrest Ave
- 4027 Bridgeview Cir
- 4017 Bridgeview Cir