Estimated Value: $325,537 - $347,000
4
Beds
3
Baths
1,800
Sq Ft
$187/Sq Ft
Est. Value
About This Home
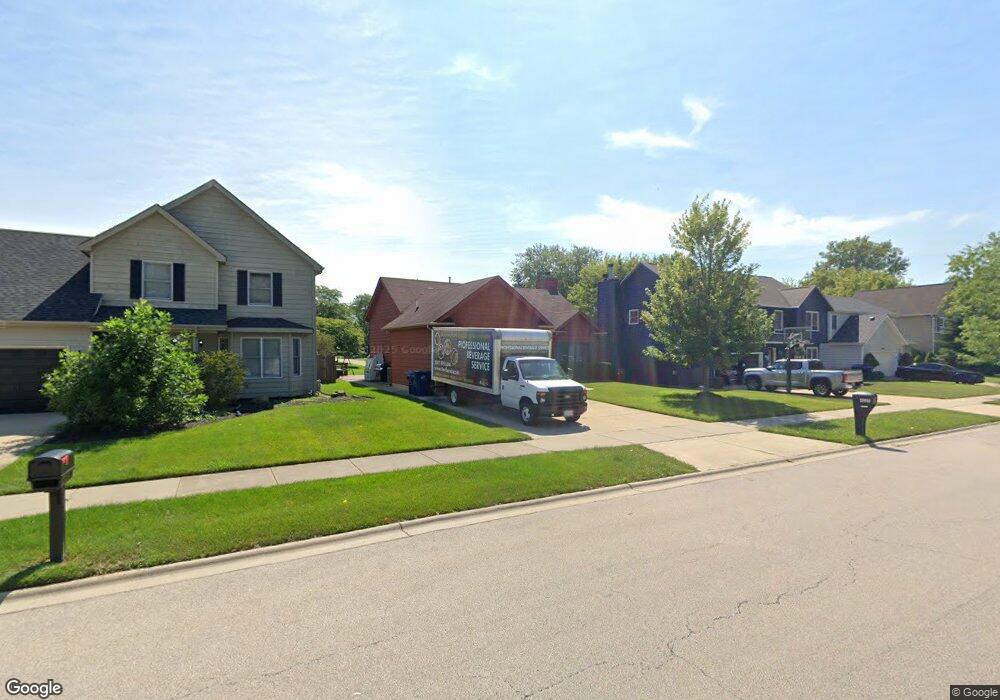
This home is located at 4025 Bertrand Ln, Zion, IL 60099 and is currently estimated at $335,884, approximately $186 per square foot. 4025 Bertrand Ln is a home located in Lake County with nearby schools including Howe Elementary School, Beach Park Middle School, and Zion-Benton Township High School.
Ownership History
Date
Name
Owned For
Owner Type
Purchase Details
Closed on
Sep 17, 2014
Sold by
Mcardle Walter J
Bought by
Mcardle Walter J and Walter J Mcardle Living Trust
Current Estimated Value
Purchase Details
Closed on
Oct 26, 2007
Sold by
Mckerlie Michelle
Bought by
Mcardle Walter J
Home Financials for this Owner
Home Financials are based on the most recent Mortgage that was taken out on this home.
Original Mortgage
$195,200
Outstanding Balance
$123,186
Interest Rate
6.33%
Mortgage Type
Purchase Money Mortgage
Estimated Equity
$212,698
Purchase Details
Closed on
Apr 17, 2001
Sold by
Larson Alvar
Bought by
Mckerlie Michelle and Mcardle Walter J
Home Financials for this Owner
Home Financials are based on the most recent Mortgage that was taken out on this home.
Original Mortgage
$148,550
Interest Rate
7.05%
Create a Home Valuation Report for This Property
The Home Valuation Report is an in-depth analysis detailing your home's value as well as a comparison with similar homes in the area
Home Values in the Area
Average Home Value in this Area
Purchase History
| Date | Buyer | Sale Price | Title Company |
|---|---|---|---|
| Mcardle Walter J | -- | None Available | |
| Mcardle Walter J | $125,000 | None Available | |
| Mckerlie Michelle | $186,000 | Mid America Title Company |
Source: Public Records
Mortgage History
| Date | Status | Borrower | Loan Amount |
|---|---|---|---|
| Open | Mcardle Walter J | $195,200 | |
| Previous Owner | Mckerlie Michelle | $148,550 |
Source: Public Records
Tax History Compared to Growth
Tax History
| Year | Tax Paid | Tax Assessment Tax Assessment Total Assessment is a certain percentage of the fair market value that is determined by local assessors to be the total taxable value of land and additions on the property. | Land | Improvement |
|---|---|---|---|---|
| 2024 | $9,207 | $92,862 | $5,703 | $87,159 |
| 2023 | $8,811 | $81,434 | $5,505 | $75,929 |
| 2022 | $8,811 | $74,832 | $5,378 | $69,454 |
| 2021 | $7,891 | $64,099 | $5,241 | $58,858 |
| 2020 | $7,745 | $61,169 | $5,001 | $56,168 |
| 2019 | $7,725 | $58,035 | $4,745 | $53,290 |
| 2018 | $7,360 | $54,017 | $5,656 | $48,361 |
| 2017 | $7,270 | $50,816 | $5,321 | $45,495 |
| 2016 | $7,094 | $48,378 | $5,066 | $43,312 |
| 2015 | $6,866 | $44,367 | $4,646 | $39,721 |
| 2014 | $5,729 | $39,455 | $12,480 | $26,975 |
| 2012 | $5,782 | $41,001 | $12,969 | $28,032 |
Source: Public Records
Map
Nearby Homes
- 1121 Otto Graham Ln
- 3931 Bertrand Ln
- 10765 W Liberty Ave
- 38571 N Cedar Ave
- 11345 W Carnahan Ave
- 11382 W Leland Ave
- 11342-11346 W Wadsworth Rd
- 38683 N Lewis Ave
- 1667 W Beach Rd Unit 1667
- 1677 W Beach Rd Unit 1677
- 10295 W Crissy Ave
- 1730 W Beach Rd
- 3225 Gilead Ave
- 3224 Gilboa Ave
- 3221 Gideon Ave
- 39161 N Holdridge Ave
- 10209 W Crissy Ave
- 2614 33rd St
- 38176 N De Woody Rd
- 10205 W Ames Ave
- 4029 Bertrand Ln
- 4023 Bertrand Ln
- 4019 Bertrand Ln
- 4031 Bertrand Ln
- 10852 W Talmadge Ave
- 1111 Mary Jane Ln
- 1110 Otto Graham Ln
- 4015 Bertrand Ln
- 4101 Bertrand Ln
- 10851 W Talmadge Ave
- 1115 Mary Jane Ln
- 10853 W Pickford Ave
- 4105 Bertrand Ln
- 1114 Otto Graham Ln
- 10844 W Talmadge Ave
- 1112 Mary Jane Ln
- 1119 Mary Jane Ln
- 1118 Otto Graham Ln
- 10831 W Talmadge Ave
- 4109 Bertrand Ln