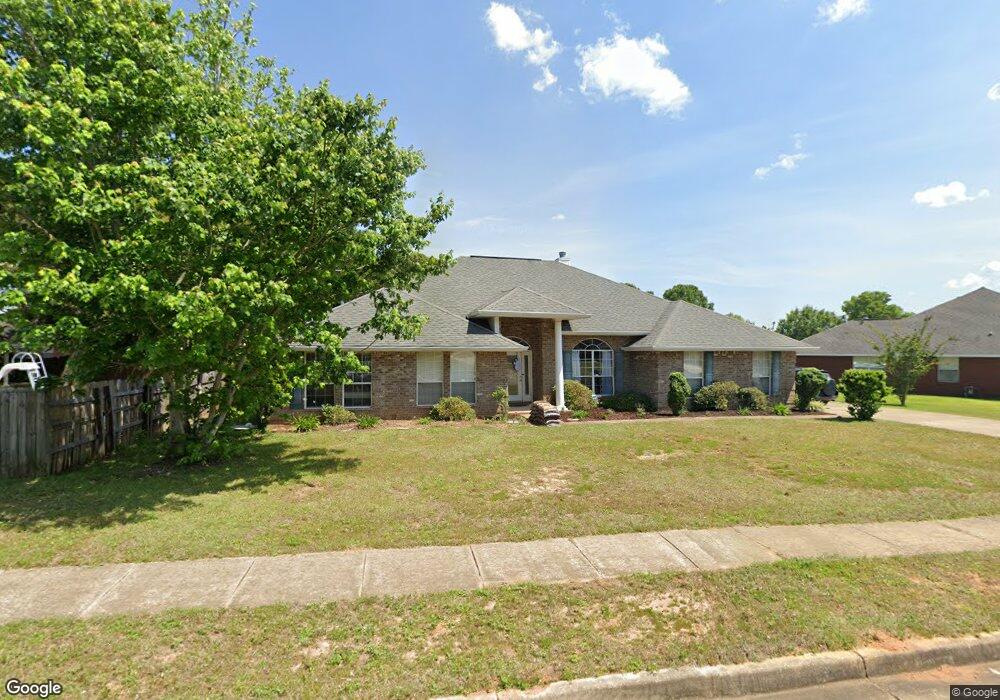
4025 Fenwick Loop W Mobile, AL 36619
Travis NeighborhoodEstimated Value: $316,000 - $395,000
4
Beds
3
Baths
2,979
Sq Ft
$117/Sq Ft
Est. Value
About This Home
This home is located at 4025 Fenwick Loop W, Mobile, AL 36619 and is currently estimated at $348,690, approximately $117 per square foot. 4025 Fenwick Loop W is a home located in Mobile County with nearby schools including Meadowlake Elementary School, Burns Middle School, and WP Davidson High School.
Ownership History
Date
Name
Owned For
Owner Type
Purchase Details
Closed on
Feb 14, 2018
Sold by
Ben S Carson
Bought by
York Jennifer and York Paul
Current Estimated Value
Home Financials for this Owner
Home Financials are based on the most recent Mortgage that was taken out on this home.
Original Mortgage
$168,000
Outstanding Balance
$142,487
Interest Rate
4.32%
Estimated Equity
$206,203
Purchase Details
Closed on
Aug 30, 2017
Sold by
Embrace Home Loans Inc
Bought by
Embrace Hud
Purchase Details
Closed on
Nov 10, 2016
Sold by
Cannella Michael R and Cannella Anna
Bought by
Embrace Home Loans Inc
Purchase Details
Closed on
Sep 14, 2007
Sold by
Adams Homes Llc
Bought by
Cannella Michael R and Cannella Anna
Home Financials for this Owner
Home Financials are based on the most recent Mortgage that was taken out on this home.
Original Mortgage
$216,150
Interest Rate
6.37%
Mortgage Type
Unknown
Create a Home Valuation Report for This Property
The Home Valuation Report is an in-depth analysis detailing your home's value as well as a comparison with similar homes in the area
Home Values in the Area
Average Home Value in this Area
Purchase History
| Date | Buyer | Sale Price | Title Company |
|---|---|---|---|
| York Jennifer | $210,000 | -- | |
| Embrace Hud | $500 | None Available | |
| Embrace Home Loans Inc | $219,299 | None Available | |
| Cannella Michael R | -- | Slt |
Source: Public Records
Mortgage History
| Date | Status | Borrower | Loan Amount |
|---|---|---|---|
| Open | York Jennifer | $168,000 | |
| Closed | York Jennifer | -- | |
| Previous Owner | Cannella Michael R | $216,150 |
Source: Public Records
Tax History
| Year | Tax Paid | Tax Assessment Tax Assessment Total Assessment is a certain percentage of the fair market value that is determined by local assessors to be the total taxable value of land and additions on the property. | Land | Improvement |
|---|---|---|---|---|
| 2025 | $1,328 | $28,740 | $5,290 | $23,450 |
| 2024 | $1,267 | $27,490 | $4,600 | $22,890 |
| 2023 | $1,387 | $21,710 | $4,200 | $17,510 |
| 2022 | $1,020 | $22,410 | $4,200 | $18,210 |
| 2021 | $1,041 | $22,830 | $4,200 | $18,630 |
| 2020 | $1,054 | $23,120 | $4,200 | $18,920 |
| 2019 | $1,056 | $23,160 | $0 | $0 |
| 2018 | $0 | $46,720 | $0 | $0 |
| 2017 | $1,067 | $23,380 | $0 | $0 |
| 2016 | $1,083 | $23,720 | $0 | $0 |
| 2013 | $1,061 | $23,060 | $0 | $0 |
Source: Public Records
Map
Nearby Homes
- 7297 Bridgemill Dr
- 7440 Meadows Dr S
- 7416 Meadow Run Ct
- 3843 Pierson Dr W
- 7194 Oakbriar Dr N
- 7330 Morse Loop
- 3910 Trumbull Ct
- 7202 Mill House Dr N
- 4301 Tara Dr E
- 7506 Carlson Ct
- 0 Mill House Dr N Unit 7709816
- 7330 Tara Dr S
- 0 Mill House Dr S Unit 7709760
- 0 Mill House Dr S Unit 7709832
- 0 Mill House Dr S Unit 7709772
- 4261 Honey Ct
- 0 Sollie Rd
- 4007 Kingsrow
- 7820 Fordham Rd
- 7810 Country Dr
- 4045 Fenwick Loop W
- 7321 Bridgemill Dr
- 7309 Bridgemill Dr
- 4065 Fenwick Loop W
- 4020 Fenwick Loop W
- 4030 Fenwick Loop W
- 4010 Fenwick Loop W
- 7285 Bridgemill Dr
- 4040 Fenwick Loop W
- 7320 Bridgemill Dr
- 7310 Bridgemill Dr
- 4075 Fenwick Loop W
- 4086 Fenwick Loop
- 4050 Fenwick Loop W
- 7298 Bridgemill Dr
- 4060 Fenwick Loop W
- 4085 Fenwick Loop W
- 7355 Meadows Dr S
- 3990 Fenwick Loop W
- 7365 Meadows Dr S
Your Personal Tour Guide
Ask me questions while you tour the home.