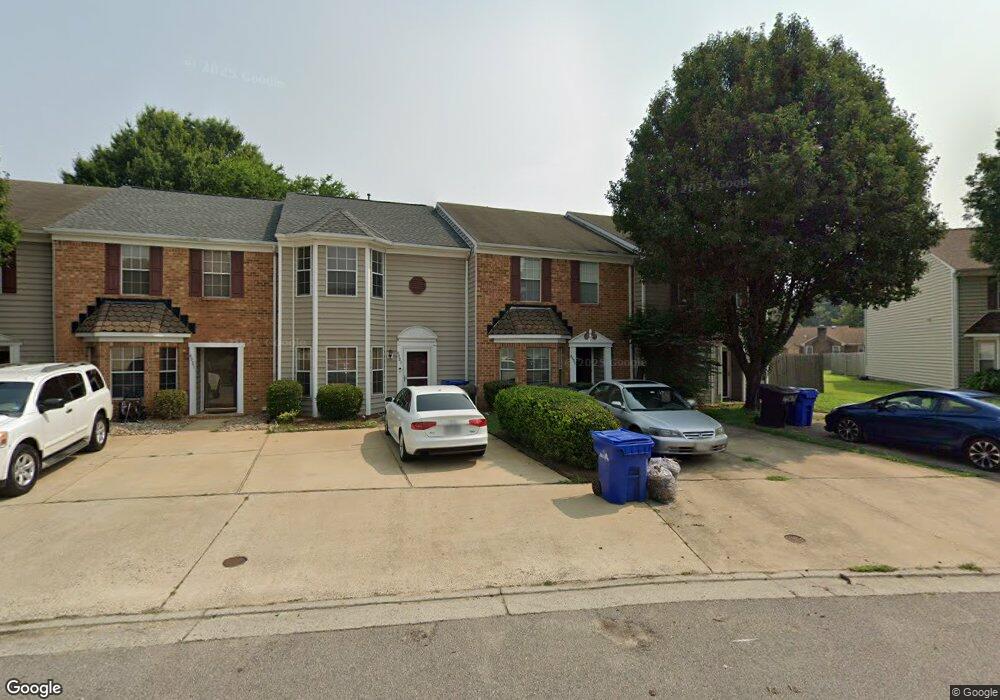
4025 Ketch Dr Portsmouth, VA 23703
Churchland NeighborhoodEstimated Value: $218,000 - $258,000
3
Beds
3
Baths
1,514
Sq Ft
$160/Sq Ft
Est. Value
About This Home
This home is located at 4025 Ketch Dr, Portsmouth, VA 23703 and is currently estimated at $242,086, approximately $159 per square foot. 4025 Ketch Dr is a home located in Portsmouth City with nearby schools including Churchland Primary/Intermediate School, Churchland Middle School, and Churchland High School.
Ownership History
Date
Name
Owned For
Owner Type
Purchase Details
Closed on
Nov 1, 2012
Sold by
Secretary Of Housing And Urban
Bought by
Sharnell White Tresha
Current Estimated Value
Home Financials for this Owner
Home Financials are based on the most recent Mortgage that was taken out on this home.
Original Mortgage
$106,436
Outstanding Balance
$72,795
Interest Rate
3.25%
Mortgage Type
FHA
Estimated Equity
$169,291
Purchase Details
Closed on
May 3, 2012
Sold by
Bank Of America Na
Bought by
Secy Of H U D
Purchase Details
Closed on
Apr 11, 2012
Sold by
Alg Trustee Llc and Glennon Vernice S
Bought by
Bank Of America Na
Purchase Details
Closed on
Dec 16, 2003
Sold by
Kight Aaron
Bought by
Glennon Vernice
Home Financials for this Owner
Home Financials are based on the most recent Mortgage that was taken out on this home.
Original Mortgage
$92,365
Interest Rate
5.88%
Mortgage Type
FHA
Purchase Details
Closed on
May 16, 2002
Sold by
Rosewell Hms Inc
Bought by
Knight Aaron
Home Financials for this Owner
Home Financials are based on the most recent Mortgage that was taken out on this home.
Original Mortgage
$86,901
Interest Rate
7%
Mortgage Type
New Conventional
Create a Home Valuation Report for This Property
The Home Valuation Report is an in-depth analysis detailing your home's value as well as a comparison with similar homes in the area
Home Values in the Area
Average Home Value in this Area
Purchase History
| Date | Buyer | Sale Price | Title Company |
|---|---|---|---|
| Sharnell White Tresha | $108,400 | -- | |
| Secy Of H U D | $178,694 | -- | |
| Bank Of America Na | $178,694 | -- | |
| Glennon Vernice | $106,900 | -- | |
| Knight Aaron | $87,250 | -- |
Source: Public Records
Mortgage History
| Date | Status | Borrower | Loan Amount |
|---|---|---|---|
| Open | Sharnell White Tresha | $106,436 | |
| Previous Owner | Glennon Vernice | $92,365 | |
| Previous Owner | Knight Aaron | $86,901 |
Source: Public Records
Tax History Compared to Growth
Tax History
| Year | Tax Paid | Tax Assessment Tax Assessment Total Assessment is a certain percentage of the fair market value that is determined by local assessors to be the total taxable value of land and additions on the property. | Land | Improvement |
|---|---|---|---|---|
| 2025 | $2,479 | $214,090 | $50,000 | $164,090 |
| 2024 | $2,479 | $187,680 | $37,500 | $150,180 |
| 2023 | $2,329 | $186,290 | $37,500 | $148,790 |
| 2022 | $2,140 | $164,590 | $30,000 | $134,590 |
| 2021 | $2,006 | $154,290 | $22,000 | $132,290 |
| 2020 | $1,849 | $142,260 | $22,000 | $120,260 |
| 2019 | $1,775 | $136,540 | $22,000 | $114,540 |
| 2018 | $1,890 | $145,400 | $17,220 | $128,180 |
| 2017 | $1,890 | $145,400 | $17,220 | $128,180 |
| 2016 | $1,890 | $145,400 | $17,220 | $128,180 |
| 2015 | $1,927 | $148,250 | $17,220 | $131,030 |
| 2014 | $1,937 | $152,520 | $17,220 | $135,300 |
Source: Public Records
Map
Nearby Homes
- 3877 Peachtree Ln W
- 3818 Peach Orchard Cir
- 17 Shoal Ct
- 3866 Augustine Cir
- 3913 Stateflower Ct
- 3860 Sugar Creek Cir
- 4071 Long Point Blvd
- 8 Compass Ct
- 3817 Harvest Ct
- 4100 Mayfair Way
- 6446 Olde Bullocks Cir
- 3660B Towne Point Rd Unit A
- 6417 Pelican Crescent N
- 3791 Towne Point Rd
- 5807 Dunkin St
- 3433 Willow Breeze Dr
- 3715 Magnolia Dr
- 3705 Bamboo Rd
- 4200 Quince Rd
- 6109 Compton Ct