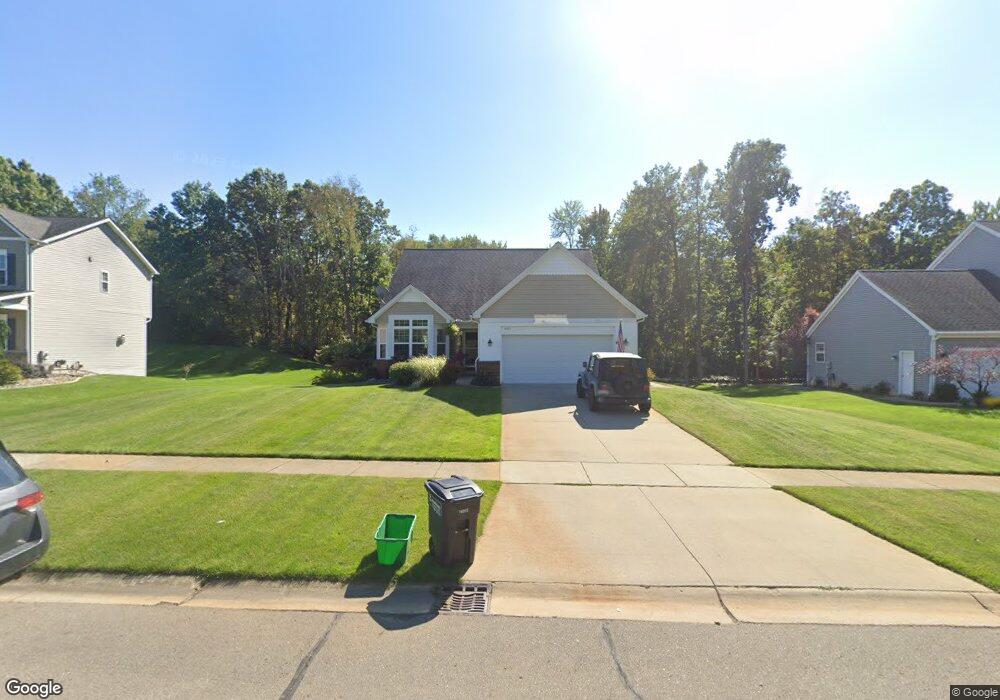
4025 Magnolia Pkwy Unit 17 Jackson, MI 49201
Estimated Value: $396,815 - $445,000
4
Beds
3
Baths
1,856
Sq Ft
$231/Sq Ft
Est. Value
About This Home
This home is located at 4025 Magnolia Pkwy Unit 17, Jackson, MI 49201 and is currently estimated at $428,704, approximately $230 per square foot. 4025 Magnolia Pkwy Unit 17 is a home located in Jackson County with nearby schools including Western High School, Paragon Charter Academy, and Da Vinci Institute High School.
Ownership History
Date
Name
Owned For
Owner Type
Purchase Details
Closed on
Nov 22, 2019
Sold by
Carter Clifford J and Carter Alyson L
Bought by
Carter Clifford J and Carter Alyson L
Current Estimated Value
Purchase Details
Closed on
Aug 26, 2011
Sold by
Grainger Grant B and Grainger Debra S
Bought by
Carter Clifford and Carter Alyson
Home Financials for this Owner
Home Financials are based on the most recent Mortgage that was taken out on this home.
Original Mortgage
$213,650
Outstanding Balance
$148,592
Interest Rate
4.59%
Mortgage Type
New Conventional
Estimated Equity
$280,112
Purchase Details
Closed on
Jul 26, 2006
Sold by
Magnolia Park Development Ltd
Bought by
Grainger Grant B and Grainger Debra S
Home Financials for this Owner
Home Financials are based on the most recent Mortgage that was taken out on this home.
Original Mortgage
$90,000
Interest Rate
6.1%
Mortgage Type
Purchase Money Mortgage
Create a Home Valuation Report for This Property
The Home Valuation Report is an in-depth analysis detailing your home's value as well as a comparison with similar homes in the area
Home Values in the Area
Average Home Value in this Area
Purchase History
| Date | Buyer | Sale Price | Title Company |
|---|---|---|---|
| Carter Clifford J | -- | None Available | |
| Carter Clifford | $224,900 | At | |
| Grainger Grant B | $236,686 | At |
Source: Public Records
Mortgage History
| Date | Status | Borrower | Loan Amount |
|---|---|---|---|
| Open | Carter Clifford | $213,650 | |
| Previous Owner | Grainger Grant B | $90,000 |
Source: Public Records
Tax History Compared to Growth
Tax History
| Year | Tax Paid | Tax Assessment Tax Assessment Total Assessment is a certain percentage of the fair market value that is determined by local assessors to be the total taxable value of land and additions on the property. | Land | Improvement |
|---|---|---|---|---|
| 2025 | $4,949 | $195,400 | $0 | $0 |
| 2024 | $2,937 | $190,400 | $0 | $0 |
| 2023 | $2,938 | $182,500 | $0 | $0 |
| 2022 | $4,491 | $177,000 | $0 | $0 |
| 2021 | $4,410 | $164,490 | $0 | $0 |
| 2020 | $4,357 | $144,000 | $0 | $0 |
| 2019 | $4,142 | $132,470 | $0 | $0 |
| 2018 | $3,561 | $114,450 | $17,320 | $97,130 |
| 2017 | $3,373 | $110,000 | $0 | $0 |
| 2016 | $2,153 | $109,160 | $109,160 | $0 |
| 2015 | $88,473 | $99,960 | $99,960 | $0 |
| 2014 | $88,473 | $91,120 | $91,120 | $0 |
| 2013 | -- | $91,120 | $91,120 | $0 |
Source: Public Records
Map
Nearby Homes
- 4116 Mulberry Cir Unit 31
- 2968 Sheridan Cirlce Unit 44
- 2924 Sheridan Cirlce Unit 57
- The Yorkshire Plan at Preserve at Magnolia Park
- The Yately Plan at Preserve at Magnolia Park
- The Winslow Plan at Preserve at Magnolia Park
- The Springfield Plan at Preserve at Magnolia Park
- The Natural Plan at Preserve at Magnolia Park
- The Middleton Plan at Preserve at Magnolia Park
- The Malden Plan at Preserve at Magnolia Park
- The Lancaster Plan at Preserve at Magnolia Park
- The Kettering Plan at Preserve at Magnolia Park
- The Kensington Plan at Preserve at Magnolia Park
- The Hartland Plan at Preserve at Magnolia Park
- The Hampshire Plan at Preserve at Magnolia Park
- The Georgetown 2 Plan at Preserve at Magnolia Park
- The Eaton Plan at Preserve at Magnolia Park
- The Davenport Plan at Preserve at Magnolia Park
- The Chesterfield Plan at Preserve at Magnolia Park
- The Briarhaven III Plan at Preserve at Magnolia Park
- 4029 Magnolia Pkwy Unit 15
- 4021 Magnolia Pkwy Unit 18
- 4021 Magnolia Pkwy
- 4021 Magnolia Park Way
- 4033 Magnolia Pkwy Unit 16
- 4017 Magnolia Pkwy Unit 19
- 4037 Magnolia Park Way Unit 15
- 4037 Magnolia Park Way
- 4013 Magnolia Pkwy Unit 20
- 4037 Magnolia Pkwy Unit 14
- 4037 Magnolia Pkwy
- 4045 Magnolia Pkwy
- 4009 Magnolia Pkwy Unit WAY
- 4009 Magnolia Pkwy
- 4152 Mulberry Cir Unit 23
- 4049 Magnolia Pkwy Unit 6
- 4005 Magnolia Pkwy Unit 22
- 3962 Magnolia Pkwy Unit 36
- 3962 Magnolia Pkwy
- 4148 Mulberry Cir Unit 26