Estimated Value: $227,000 - $389,000
3
Beds
2
Baths
1,574
Sq Ft
$203/Sq Ft
Est. Value
About This Home
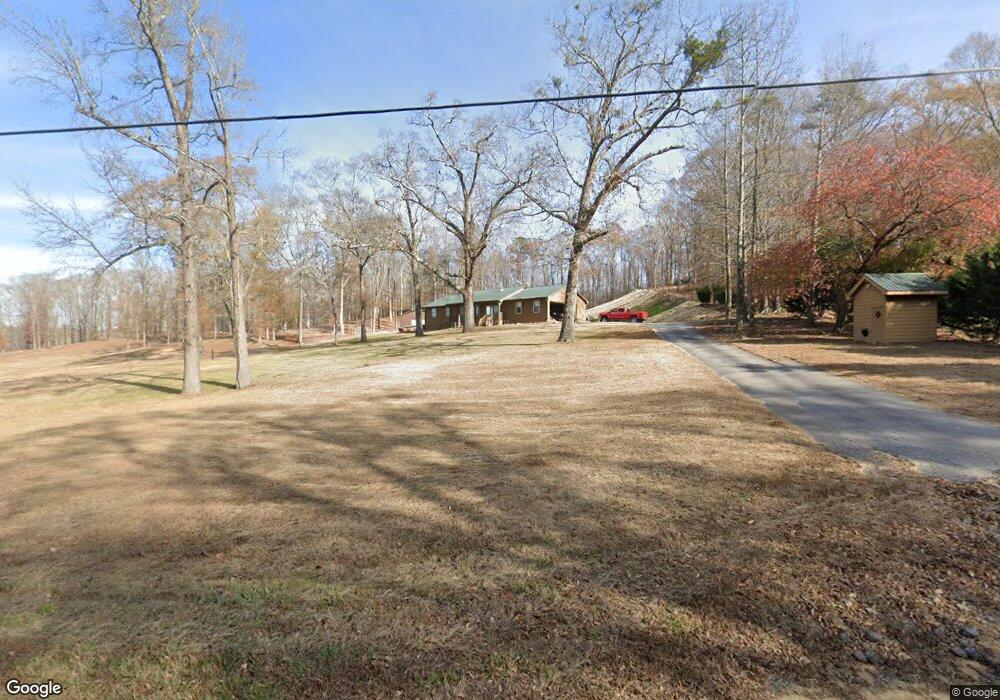
This home is located at 4025 Talmo Rd, Talmo, GA 30575 and is currently estimated at $319,406, approximately $202 per square foot. 4025 Talmo Rd is a home located in Hall County with nearby schools including Myers Elementary School, South Hall Middle School, and Johnson High School.
Ownership History
Date
Name
Owned For
Owner Type
Purchase Details
Closed on
Oct 31, 2018
Sold by
Simpson Angela M
Bought by
Bell Andrea Stewart and Bell Gregory
Current Estimated Value
Home Financials for this Owner
Home Financials are based on the most recent Mortgage that was taken out on this home.
Original Mortgage
$166,250
Outstanding Balance
$143,755
Interest Rate
4.7%
Mortgage Type
New Conventional
Estimated Equity
$175,651
Purchase Details
Closed on
Oct 25, 2010
Sold by
Simpson Angie
Bought by
Simpson Angela M
Home Financials for this Owner
Home Financials are based on the most recent Mortgage that was taken out on this home.
Original Mortgage
$90,000
Interest Rate
4.37%
Mortgage Type
New Conventional
Purchase Details
Closed on
May 3, 2007
Sold by
Chapman Denward Clayton
Bought by
Chapman Martha Gail
Purchase Details
Closed on
May 1, 1994
Create a Home Valuation Report for This Property
The Home Valuation Report is an in-depth analysis detailing your home's value as well as a comparison with similar homes in the area
Home Values in the Area
Average Home Value in this Area
Purchase History
| Date | Buyer | Sale Price | Title Company |
|---|---|---|---|
| Bell Andrea Stewart | $175,000 | -- | |
| Simpson Angela M | -- | -- | |
| Chapman Martha Gail | -- | -- | |
| -- | $55,000 | -- |
Source: Public Records
Mortgage History
| Date | Status | Borrower | Loan Amount |
|---|---|---|---|
| Open | Bell Andrea Stewart | $166,250 | |
| Previous Owner | Simpson Angela M | $90,000 |
Source: Public Records
Tax History
| Year | Tax Paid | Tax Assessment Tax Assessment Total Assessment is a certain percentage of the fair market value that is determined by local assessors to be the total taxable value of land and additions on the property. | Land | Improvement |
|---|---|---|---|---|
| 2025 | $2,979 | $130,560 | $24,000 | $106,560 |
| 2024 | $3,251 | $130,640 | $24,000 | $106,640 |
| 2023 | $3,204 | $123,560 | $24,000 | $99,560 |
| 2022 | $2,206 | $84,760 | $8,200 | $76,560 |
| 2021 | $2,090 | $78,840 | $8,200 | $70,640 |
| 2020 | $2,055 | $75,360 | $8,200 | $67,160 |
| 2019 | $1,982 | $70,360 | $8,200 | $62,160 |
| 2018 | $1,570 | $53,113 | $8,280 | $44,833 |
| 2017 | $1,543 | $52,713 | $8,280 | $44,433 |
| 2016 | $1,507 | $52,713 | $8,280 | $44,433 |
| 2015 | $1,519 | $52,713 | $8,280 | $44,433 |
| 2014 | $1,519 | $52,713 | $8,280 | $44,433 |
Source: Public Records
Map
Nearby Homes
- 8.2 ACRES Roy Parks Rd
- 3462 Roy Parks Rd
- 3656 Candler Rd
- 3455 Navigator Ln
- 3004 Candler Rd
- 3845 Chase Dr
- 3300 Athens Hwy
- 1 Cooper Bridge Rd
- 3 Cooper Bridge Rd
- 3263 Tanners Mill Rd
- 3255 Tanners Mill Rd
- 0 Guy Cooper Rd Unit 10545221
- 4515 Highway 60
- 5011 Weaver Rd
- 5109 Peach Mountain Cir
- 4984 Poplar Springs Cir
- 100 Gleneagles Way
- 4990 Poplar Springs Cir
- 5082 Peach Mountain Cir
- 3325 Tanners Mill Rd
Your Personal Tour Guide
Ask me questions while you tour the home.