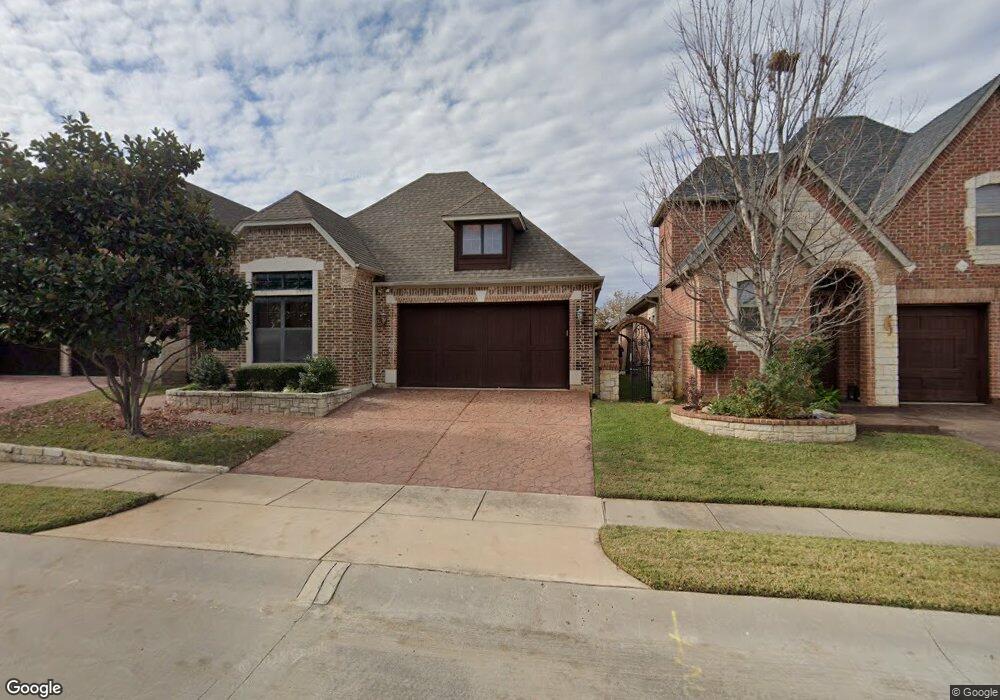
4025 Westmont Ct Bedford, TX 76021
Estimated Value: $512,327 - $593,000
3
Beds
3
Baths
2,283
Sq Ft
$244/Sq Ft
Est. Value
About This Home
This home is located at 4025 Westmont Ct, Bedford, TX 76021 and is currently estimated at $556,582, approximately $243 per square foot. 4025 Westmont Ct is a home located in Tarrant County with nearby schools including Meadow Creek Elementary School, Harwood Junior High School, and Trinity High School.
Ownership History
Date
Name
Owned For
Owner Type
Purchase Details
Closed on
May 9, 2017
Sold by
Chandler Raman
Bought by
Longey Susan M
Current Estimated Value
Purchase Details
Closed on
Feb 2, 2016
Sold by
Wright Corey
Bought by
Laing Kelley M and Laing Bruce
Home Financials for this Owner
Home Financials are based on the most recent Mortgage that was taken out on this home.
Original Mortgage
$285,000
Interest Rate
3.99%
Mortgage Type
Construction
Purchase Details
Closed on
Jul 2, 2012
Sold by
Raco Development Llc
Bought by
Chandler Raman
Purchase Details
Closed on
Mar 5, 2007
Sold by
The Fairmont Villas Ltd
Bought by
Raco Development Llc
Home Financials for this Owner
Home Financials are based on the most recent Mortgage that was taken out on this home.
Original Mortgage
$260,000
Interest Rate
6.25%
Mortgage Type
Purchase Money Mortgage
Create a Home Valuation Report for This Property
The Home Valuation Report is an in-depth analysis detailing your home's value as well as a comparison with similar homes in the area
Home Values in the Area
Average Home Value in this Area
Purchase History
| Date | Buyer | Sale Price | Title Company |
|---|---|---|---|
| Longey Susan M | -- | Fatco | |
| Laing Kelley M | -- | Ort | |
| Chandler Raman | -- | None Available | |
| Raco Development Llc | -- | Sendera Title |
Source: Public Records
Mortgage History
| Date | Status | Borrower | Loan Amount |
|---|---|---|---|
| Previous Owner | Laing Kelley M | $285,000 | |
| Previous Owner | Raco Development Llc | $260,000 |
Source: Public Records
Tax History Compared to Growth
Tax History
| Year | Tax Paid | Tax Assessment Tax Assessment Total Assessment is a certain percentage of the fair market value that is determined by local assessors to be the total taxable value of land and additions on the property. | Land | Improvement |
|---|---|---|---|---|
| 2025 | $8,099 | $487,046 | $90,000 | $397,046 |
| 2024 | $8,099 | $487,046 | $90,000 | $397,046 |
| 2023 | $8,955 | $473,914 | $75,000 | $398,914 |
| 2022 | $9,271 | $439,900 | $75,000 | $364,900 |
| 2021 | $9,090 | $385,875 | $75,000 | $310,875 |
| 2020 | $9,175 | $385,875 | $75,000 | $310,875 |
| 2019 | $9,374 | $385,875 | $75,000 | $310,875 |
| 2018 | $8,546 | $367,500 | $75,000 | $292,500 |
| 2017 | $8,592 | $355,171 | $35,000 | $320,171 |
| 2016 | $8,574 | $354,416 | $35,000 | $319,416 |
| 2015 | $7,785 | $310,000 | $35,000 | $275,000 |
| 2014 | $7,785 | $310,000 | $35,000 | $275,000 |
Source: Public Records
Map
Nearby Homes
- 4001 Fairmont Ct
- 3112 Hazlewood Ct
- 3409 Langley Hill Ln
- 3409 Crescent Ct
- 3932 Cedar Ridge Dr
- 3013 Bent Tree Ln
- 3917 Autumn Ln
- 3516 Lejoie Ln
- 3909 Allendale St
- 3024 Pecan Cir
- 3901 Campania Ct
- 4005 Campania Ct
- 4208 Lombardy Ct
- 3405 Scenic Hills Dr
- 3713 Teal Ln
- 4300 Eaton Cir
- 3428 Pembroke Place
- 2904 Hickory Hill St
- 2904 Hickory Hill Ln
- 3017 Bluebonnet Ln
- 4021 Westmont Ct
- 4029 Westmont Ct
- 4033 Westmont Ct
- 4024 Martin Dr
- 4028 Martin Dr
- 4020 Martin Dr
- 4013 Westmont Ct
- 4032 Martin Dr
- 4016 Martin Dr
- 4024 Westmont Ct
- 4009 Westmont Ct
- 4028 Westmont Ct
- 4012 Martin Dr
- 4020 Westmont Ct
- 4032 Westmont Ct
- 4016 Westmont Ct
- 4008 Martin Dr
- 4012 Westmont Ct
- 4008 Westmont Ct
- 3901 Martin Pkwy