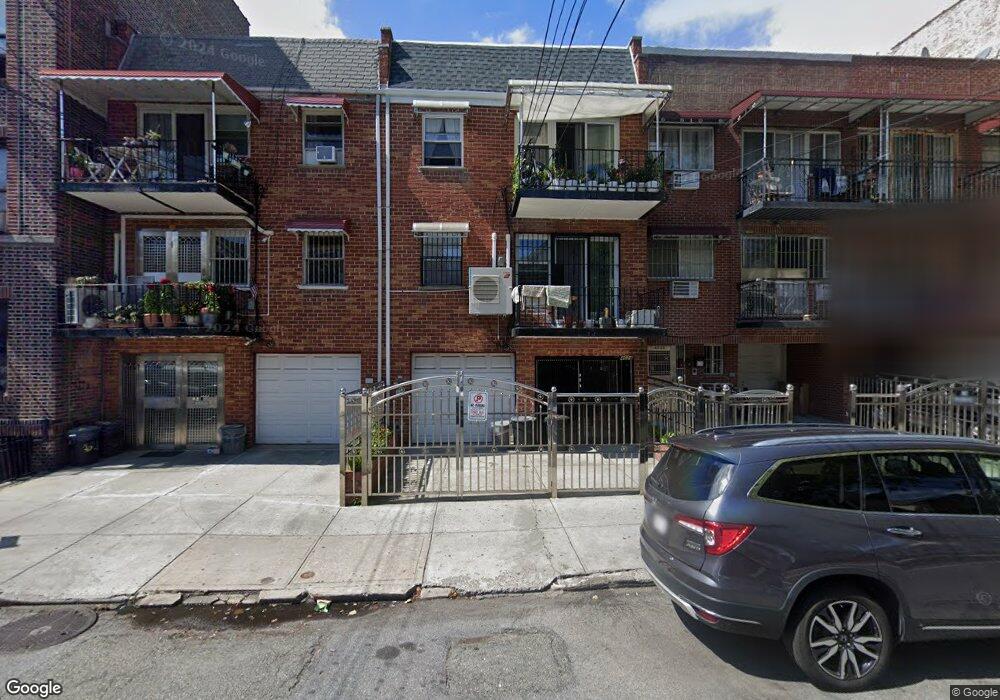
4026 73rd St Woodside, NY 11377
Elmhurst NeighborhoodEstimated Value: $1,050,000 - $1,959,000
--
Bed
--
Bath
3,180
Sq Ft
$499/Sq Ft
Est. Value
About This Home
This home is located at 4026 73rd St, Woodside, NY 11377 and is currently estimated at $1,586,667, approximately $498 per square foot. 4026 73rd St is a home located in Queens County with nearby schools including P.S. 12 James B Colgate, Is 5 The Walter Crowley Intermediate School, and William Cullen Bryant High School.
Ownership History
Date
Name
Owned For
Owner Type
Purchase Details
Closed on
Oct 23, 2014
Sold by
Li Lisa and Liu Anson
Bought by
Liu Anson
Current Estimated Value
Purchase Details
Closed on
May 31, 2001
Sold by
Disaverio Antonio
Bought by
Liu Shi Ci and Li Lisa
Home Financials for this Owner
Home Financials are based on the most recent Mortgage that was taken out on this home.
Original Mortgage
$425,000
Interest Rate
7.09%
Purchase Details
Closed on
May 3, 2001
Sold by
Disaverio Antonio
Bought by
Yau Hok Wai and Li Oi Kam
Home Financials for this Owner
Home Financials are based on the most recent Mortgage that was taken out on this home.
Original Mortgage
$425,000
Interest Rate
7.09%
Purchase Details
Closed on
Aug 2, 1999
Sold by
Wegman Steven
Bought by
Disaverio Antonio
Home Financials for this Owner
Home Financials are based on the most recent Mortgage that was taken out on this home.
Original Mortgage
$217,000
Interest Rate
7.6%
Create a Home Valuation Report for This Property
The Home Valuation Report is an in-depth analysis detailing your home's value as well as a comparison with similar homes in the area
Home Values in the Area
Average Home Value in this Area
Purchase History
| Date | Buyer | Sale Price | Title Company |
|---|---|---|---|
| Liu Anson | $478,000 | -- | |
| Liu Shi Ci | -- | -- | |
| Yau Hok Wai | -- | -- | |
| Disaverio Antonio | $310,000 | Chicago Title Insurance Co |
Source: Public Records
Mortgage History
| Date | Status | Borrower | Loan Amount |
|---|---|---|---|
| Previous Owner | Liu Shi Ci | $425,000 | |
| Previous Owner | Yau Hok Wai | $230,000 | |
| Previous Owner | Disaverio Antonio | $217,000 |
Source: Public Records
Tax History Compared to Growth
Tax History
| Year | Tax Paid | Tax Assessment Tax Assessment Total Assessment is a certain percentage of the fair market value that is determined by local assessors to be the total taxable value of land and additions on the property. | Land | Improvement |
|---|---|---|---|---|
| 2025 | $7,007 | $75,894 | $21,642 | $54,252 |
| 2024 | $7,007 | $75,893 | $21,450 | $54,443 |
| 2023 | $4,238 | $75,322 | $17,969 | $57,353 |
| 2022 | $1,507 | $116,640 | $30,660 | $85,980 |
| 2021 | $1,588 | $104,100 | $30,660 | $73,440 |
| 2020 | $1,597 | $97,140 | $30,660 | $66,480 |
| 2019 | $1,579 | $93,960 | $30,660 | $63,300 |
| 2018 | $1,538 | $62,768 | $19,264 | $43,504 |
| 2017 | $1,538 | $59,216 | $21,043 | $38,173 |
| 2016 | $1,509 | $59,216 | $21,043 | $38,173 |
| 2015 | $1,030 | $52,704 | $26,099 | $26,605 |
| 2014 | $1,030 | $52,704 | $31,314 | $21,390 |
Source: Public Records
Map
Nearby Homes
- 40 E 73rd St
- 40-33 74th St
- 40-40 75th St Unit 7C
- 40-40 75th St Unit 3J
- 40-24 76th St Unit 3B
- 40-24 76th St Unit 4A
- 3745 75th St
- 4015 76th St
- 41-24 76th St
- 41-42 73rd St Unit 7J
- 41-42 73rd St Unit 6J
- 3747 76th St
- 41-23 76th St Unit 2B
- 4037 77th St Unit 5
- 4155 73rd St
- 37-52 77th St
- 4110 71st St
- 41-28 71st St Unit 4D
- 41-49 71st St
- 72-15 37th Ave Unit 4B
- 4026 73rd St Unit 2FL
- 40-26 73rd St
- 4028 73rd St
- 40-28A 73rd St
- 4024 73rd St
- 4028A 73rd St
- 4016 73rd St Unit C2
- 4016 73rd St Unit B3
- 4016 73rd St Unit 5
- 4016 73rd St Unit 3Fl
- 4016 73rd St Unit D4
- 4016 73rd St Unit C2
- 4016 73rd St Unit D5
- 4016 73rd St Unit D5
- 4016 73rd St Unit D4
- 4030 73rd St
- 4012 73rd St Unit D3
- 4012 73rd St Unit C3
- 4012 73rd St Unit A 1
- 4012 73rd St