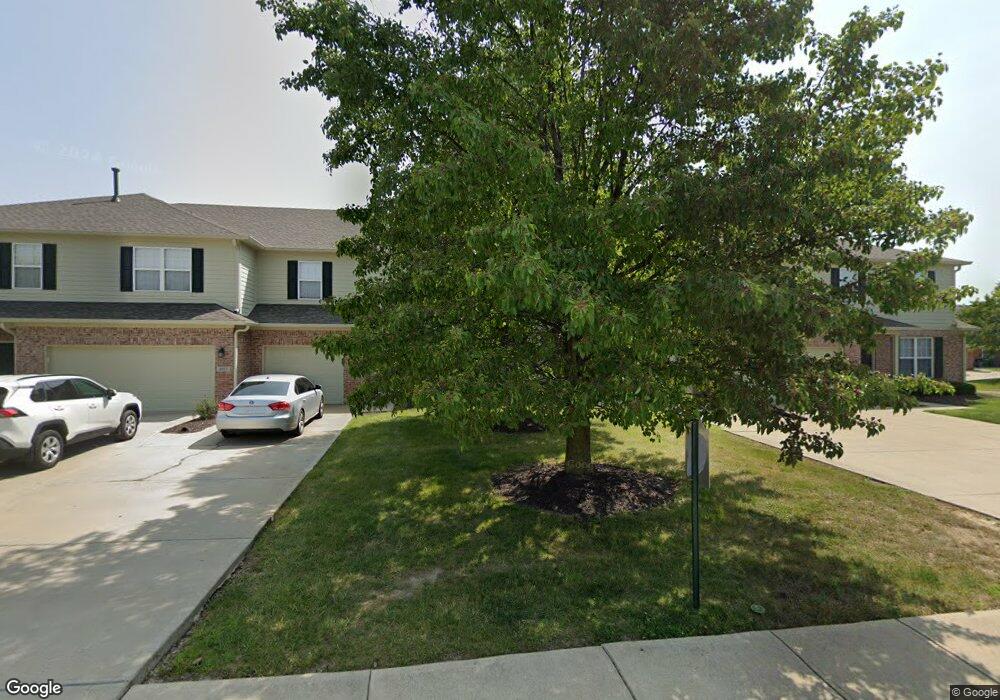
4026 Bullfinch Way Westfield, IN 46062
West Noblesville NeighborhoodEstimated Value: $271,000 - $275,877
3
Beds
3
Baths
1,968
Sq Ft
$139/Sq Ft
Est. Value
About This Home
This home is located at 4026 Bullfinch Way, Westfield, IN 46062 and is currently estimated at $274,219, approximately $139 per square foot. 4026 Bullfinch Way is a home located in Hamilton County with nearby schools including Washington Woods Elementary School, Westfield Intermediate School, and Westfield Middle School.
Ownership History
Date
Name
Owned For
Owner Type
Purchase Details
Closed on
Jul 13, 2016
Sold by
Tps Properties Lc
Bought by
Perkul Michael R
Current Estimated Value
Home Financials for this Owner
Home Financials are based on the most recent Mortgage that was taken out on this home.
Original Mortgage
$71,152
Outstanding Balance
$32,371
Interest Rate
3.66%
Mortgage Type
New Conventional
Estimated Equity
$241,848
Purchase Details
Closed on
May 11, 2009
Sold by
Pekrul Michael R
Bought by
T P S Properties Llc
Purchase Details
Closed on
Sep 26, 2008
Sold by
Watkins Amelia H
Bought by
Pekrul Michael R
Home Financials for this Owner
Home Financials are based on the most recent Mortgage that was taken out on this home.
Original Mortgage
$82,200
Interest Rate
6.43%
Mortgage Type
Unknown
Purchase Details
Closed on
Dec 8, 2005
Sold by
Jordan Management Llc
Bought by
Rdj Custom Homes
Create a Home Valuation Report for This Property
The Home Valuation Report is an in-depth analysis detailing your home's value as well as a comparison with similar homes in the area
Home Values in the Area
Average Home Value in this Area
Purchase History
| Date | Buyer | Sale Price | Title Company |
|---|---|---|---|
| Perkul Michael R | -- | National Link | |
| T P S Properties Llc | -- | None Available | |
| Pekrul Michael R | -- | None Available | |
| Rdj Custom Homes | -- | None Available |
Source: Public Records
Mortgage History
| Date | Status | Borrower | Loan Amount |
|---|---|---|---|
| Open | Perkul Michael R | $71,152 | |
| Previous Owner | Pekrul Michael R | $82,200 |
Source: Public Records
Tax History Compared to Growth
Tax History
| Year | Tax Paid | Tax Assessment Tax Assessment Total Assessment is a certain percentage of the fair market value that is determined by local assessors to be the total taxable value of land and additions on the property. | Land | Improvement |
|---|---|---|---|---|
| 2024 | $5,086 | $225,000 | $13,100 | $211,900 |
| 2023 | $5,121 | $225,300 | $13,100 | $212,200 |
| 2022 | $4,578 | $199,600 | $13,100 | $186,500 |
| 2021 | $3,794 | $160,400 | $13,100 | $147,300 |
| 2020 | $3,742 | $156,800 | $13,100 | $143,700 |
| 2019 | $3,248 | $135,900 | $13,100 | $122,800 |
| 2018 | $2,947 | $123,100 | $13,100 | $110,000 |
| 2017 | $2,638 | $118,300 | $13,100 | $105,200 |
| 2016 | $2,616 | $117,300 | $13,100 | $104,200 |
| 2014 | $2,246 | $100,700 | $13,100 | $87,600 |
| 2013 | $2,246 | $95,900 | $13,100 | $82,800 |
Source: Public Records
Map
Nearby Homes
- 4024 Storrow Way
- 18153 Birdview Ct
- 18426 Edinbrook Ln
- 4247 Pearson Dr
- 18081 Sanibel Cir
- 3965 Idlewind Dr
- 4722 Peabody Way
- 4863 Sherlock Dr
- LAUSANNE Plan at Belle Crest
- ZURICH Plan at Belle Crest
- LUCERNE Plan at Belle Crest
- GENEVA Plan at Belle Crest
- 3914 Holly Brook Dr
- 3914 Holly Brook Dr
- 3923 Holly Brook Dr
- 3898 Holly Brook Dr
- 3898 Holly Brook Dr
- 18229 Moontown Rd
- 3890 Holly Brook Dr
- 3890 Holly Brook Dr
- 4024 Bullfinch Way
- 4024 Bullfinch Way Unit C
- 4058 Bullfinch Way
- 4058 Bullfinch Way Unit 2
- 4052 Bullfinch Way
- 4052 Bullfinch Way Unit E
- 4052 Bullfinch Way Unit 2
- 4028 Bullfinch Way
- 4028 Bullfinch Way Unit 2
- 4062 Bullfinch Way
- 4062 Bullfinch Way Unit A
- 4068 Bullfinch Way
- 4106 Bullfinch Way
- 4108 Bullfinch Way
- 4108 Bullfinch Way Unit B
- 4102 Bullfinch Way Unit 4E
- 4051 Bullfinch Way
- 4047 Bullfinch Way
- 4047 Bullfinch Way Unit A
- 4067 Bullfinch Way