Estimated Value: $175,989 - $242,000
--
Bed
--
Bath
1,432
Sq Ft
$154/Sq Ft
Est. Value
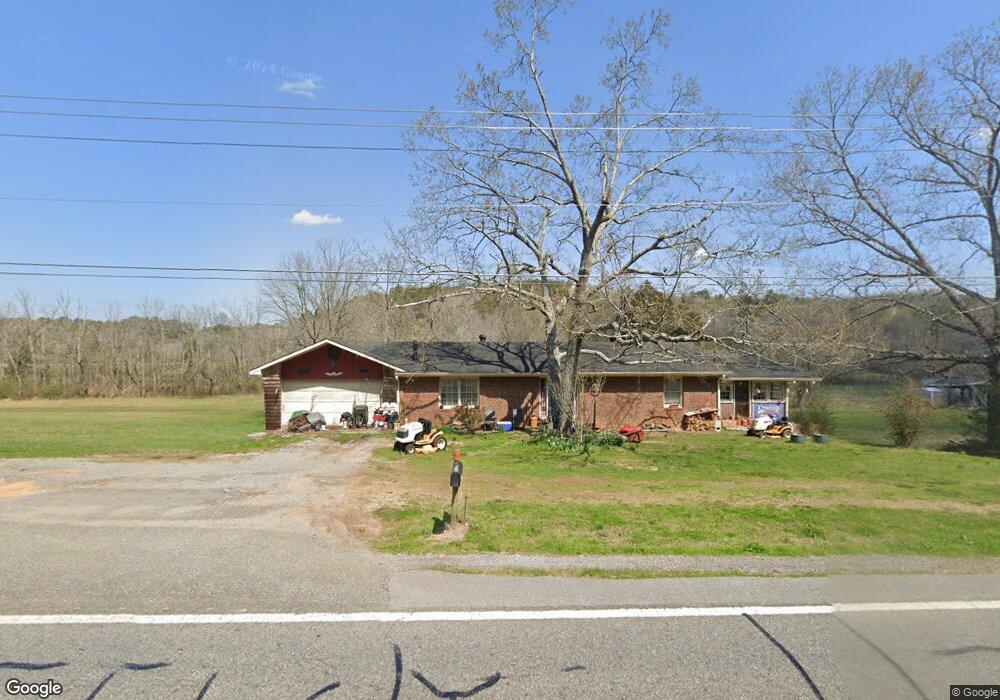
About This Home
This home is located at 4026 Cave Spring Rd SW, Rome, GA 30161 and is currently estimated at $220,497, approximately $153 per square foot. 4026 Cave Spring Rd SW is a home located in Floyd County with nearby schools including Pepperell Middle School and Pepperell High School.
Ownership History
Date
Name
Owned For
Owner Type
Purchase Details
Closed on
Jul 20, 2011
Sold by
Holtzclaw Charles Seals
Bought by
Holtzclaw Charles Seals
Current Estimated Value
Purchase Details
Closed on
Apr 7, 2010
Sold by
Holtzclaw Floyce Mae
Bought by
Holtzclaw Charles S
Purchase Details
Closed on
Aug 2, 1979
Sold by
Beecham Mary D
Bought by
Holtzclaw Floyce Mae
Purchase Details
Closed on
Aug 27, 1977
Sold by
Beecham Roy
Bought by
Beecham Mary D
Purchase Details
Closed on
May 17, 1976
Sold by
Macmacmacmacholtzclaw Floyce Mac
Bought by
Beecham Roy
Purchase Details
Closed on
Mar 13, 1973
Sold by
Phillips Larry Michael
Bought by
Macmacmacmacholtzclaw Floyce Mac
Purchase Details
Closed on
Mar 27, 1972
Sold by
Carter Mrs Burda M Paul T
Bought by
Phillips Larry Michael
Purchase Details
Closed on
Aug 19, 1964
Bought by
P and R
Purchase Details
Closed on
Jun 1, 1964
Bought by
Carter Mrs Burda M Paul T
Create a Home Valuation Report for This Property
The Home Valuation Report is an in-depth analysis detailing your home's value as well as a comparison with similar homes in the area
Home Values in the Area
Average Home Value in this Area
Purchase History
| Date | Buyer | Sale Price | Title Company |
|---|---|---|---|
| Holtzclaw Charles Seals | -- | -- | |
| Holtzclaw Charles Seals | -- | -- | |
| Holtzclaw Charles S | -- | -- | |
| Holtzclaw Floyce Mae | -- | -- | |
| Beecham Mary D | -- | -- | |
| Beecham Roy | -- | -- | |
| Macmacmacmacholtzclaw Floyce Mac | $1,000 | -- | |
| Phillips Larry Michael | $3,000 | -- | |
| P | -- | -- | |
| Carter Mrs Burda M Paul T | $25,000 | -- |
Source: Public Records
Tax History Compared to Growth
Tax History
| Year | Tax Paid | Tax Assessment Tax Assessment Total Assessment is a certain percentage of the fair market value that is determined by local assessors to be the total taxable value of land and additions on the property. | Land | Improvement |
|---|---|---|---|---|
| 2024 | $891 | $74,706 | $10,336 | $64,370 |
| 2023 | $803 | $69,088 | $9,396 | $59,692 |
| 2022 | $503 | $50,909 | $7,679 | $43,230 |
| 2021 | $346 | $42,373 | $7,001 | $35,372 |
| 2020 | $330 | $40,435 | $6,088 | $34,347 |
| 2019 | $320 | $39,378 | $6,088 | $33,290 |
| 2018 | $322 | $37,990 | $5,798 | $32,192 |
| 2017 | $323 | $37,059 | $5,369 | $31,690 |
| 2016 | $326 | $36,800 | $5,360 | $31,440 |
| 2015 | $268 | $37,248 | $5,360 | $31,888 |
| 2014 | $268 | $37,728 | $5,360 | $32,368 |
Source: Public Records
Map
Nearby Homes
- 3667 Cave Spring Rd SW
- 4365 Cave Spring Rd SW
- 0 Oakmont Dr SW Unit 10648261
- 2081 Blacks Bluff Rd SW Unit LOT A
- 2081 Blacks Bluff Lot A Rd SW
- 262 Blacks Bluff Rd SW
- 0 Blacks Bluff Rd SW Unit 17015073
- 1673 Blacks Bluff Rd SW
- 0 College View Dr SW Unit 10655489
- 0 College View Dr SW Unit 10655483
- 0 Vanns Valley Rd SW Unit 7589183
- 0 Vanns Valley Rd SW Unit 10534224
- 65 Vanns Valley Rd SW
- 31 Orchard Spring Dr SW
- 0 Chaucer Place SW Unit 7667105
- 0 Chaucer Place SW Unit 131172
- 5165 Cave Spring Rd SW
- 4 Rivermont Dr SW
- 0 Walker Mountain Rd SW Unit 10531001
- 0 Walker Mountain Rd SW Unit 7551047
- 3969 Cave Spring Rd SW
- 4002 Cave Spring Rd SW
- 4100 Cave Spring Rd SW
- 4053 Cave Spring Rd SW
- 4257 Cave Spring Rd SW
- 4261 Cave Spring Rd SW
- 4275 Cave Spring Rd SW
- 3851 Cave Spring Rd SW
- 4110 Cave Spring Rd SW
- 4120 Cave Spring Rd SW
- 3651 Cave Spring Rd SW
- 3651 Cave Spring Rd SW
- 3651 Cave Spring Rd SW
- 4074 Cave Spring Rd SW
- 4085 Cave Spring Rd SW
- 4130 Cave Spring Rd SW
- 4140 Cave Spring Rd SW
- 4176 Cave Spring Rd SW
- 4174 Cave Spring Rd SW
- 3848 Cave Spring Rd SW