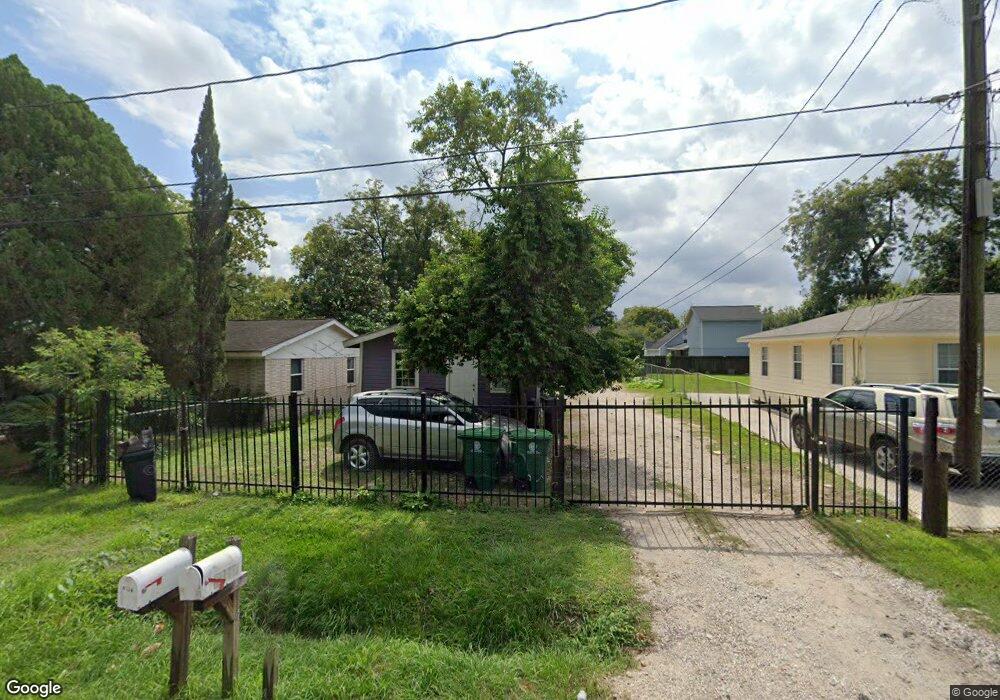
4026 Vaughn St Houston, TX 77016
Trinity-Houston Gardens NeighborhoodEstimated Value: $157,000 - $216,000
1
Bed
1
Bath
500
Sq Ft
$380/Sq Ft
Est. Value
About This Home
This home is located at 4026 Vaughn St, Houston, TX 77016 and is currently estimated at $189,990, approximately $379 per square foot. 4026 Vaughn St is a home located in Harris County with nearby schools including Roderick R. Paige Elementary School, Key Middle, and Kashmere High School.
Ownership History
Date
Name
Owned For
Owner Type
Purchase Details
Closed on
Dec 22, 2022
Sold by
Torres Ma Antonia Hernandez
Bought by
Hernandez Kimberly
Current Estimated Value
Purchase Details
Closed on
Mar 23, 2021
Sold by
Hernandez Maria Antonia
Bought by
Torres Ma Antonia Hern
Purchase Details
Closed on
Apr 13, 2005
Sold by
Zepeda Irma
Bought by
Hernandez Maria Antonia
Home Financials for this Owner
Home Financials are based on the most recent Mortgage that was taken out on this home.
Original Mortgage
$6,000
Interest Rate
13%
Mortgage Type
Purchase Money Mortgage
Purchase Details
Closed on
Mar 24, 2005
Sold by
Zepeda Ismael and Gonzalez Mercedes Zepeda
Bought by
Zepeda Irma
Home Financials for this Owner
Home Financials are based on the most recent Mortgage that was taken out on this home.
Original Mortgage
$6,000
Interest Rate
13%
Mortgage Type
Purchase Money Mortgage
Create a Home Valuation Report for This Property
The Home Valuation Report is an in-depth analysis detailing your home's value as well as a comparison with similar homes in the area
Home Values in the Area
Average Home Value in this Area
Purchase History
| Date | Buyer | Sale Price | Title Company |
|---|---|---|---|
| Hernandez Kimberly | -- | -- | |
| Torres Ma Antonia Hern | -- | None Listed On Document | |
| Hernandez Maria Antonia | -- | American Title Co | |
| Zepeda Irma | -- | -- |
Source: Public Records
Mortgage History
| Date | Status | Borrower | Loan Amount |
|---|---|---|---|
| Previous Owner | Hernandez Maria Antonia | $6,000 |
Source: Public Records
Tax History Compared to Growth
Tax History
| Year | Tax Paid | Tax Assessment Tax Assessment Total Assessment is a certain percentage of the fair market value that is determined by local assessors to be the total taxable value of land and additions on the property. | Land | Improvement |
|---|---|---|---|---|
| 2025 | $3,662 | $164,000 | $59,856 | $104,144 |
| 2024 | $3,662 | $175,000 | $59,856 | $115,144 |
| 2023 | $3,662 | $160,841 | $53,375 | $107,466 |
| 2022 | $2,532 | $115,000 | $36,219 | $78,781 |
| 2021 | $1,520 | $97,808 | $28,594 | $69,214 |
| 2020 | $1,436 | $81,341 | $18,300 | $63,041 |
| 2019 | $1,364 | $70,368 | $15,250 | $55,118 |
| 2018 | $0 | $48,992 | $9,150 | $39,842 |
| 2017 | $1,239 | $48,992 | $9,150 | $39,842 |
| 2016 | $1,239 | $48,992 | $9,150 | $39,842 |
| 2015 | $44 | $46,957 | $7,244 | $39,713 |
| 2014 | $44 | $46,957 | $7,244 | $39,713 |
Source: Public Records
Map
Nearby Homes
- 7511 Hirsch Rd
- 4006 Yorkshire St
- 4009 Yorkshire St
- 4225 Denmark St
- 7202 Los Angeles St
- 0 Glass St
- 4114 E Toliver E Street St
- 4114 E Toliver St
- 4126 Dorchester St
- 3911 Dorchester St
- 4217 E Toliver St
- 7330 Glass St
- 4129 E Toliver St
- 4133 E Toliver St
- 7508 Glass St
- 0 Dorchester St
- 4221 E Toliver St
- 4419 Denmark St
- 3711 Dorchester St
- 4103 Lumber Ln
- 4104 Vaughn St
- 4020 Vaughn St
- 4118 Vaughn St
- 4016 Vaughn St
- 4124 Vaughn St Unit B
- 4124 Vaughn St
- 4124 Vaughn St Unit A
- 4124 Vaughn St Unit B
- 4124 Vaughn St Unit A
- 4124 Vaughn St
- 4012 Vaughn St
- 4021 Vance St
- 4017 Vance St
- 4025 Vance St
- 4101 Vance St
- 4015 Vance St
- 4010 Vaughn St
- 4101 Vaughn St
- 4109 Vance St
- 4013 Vance St