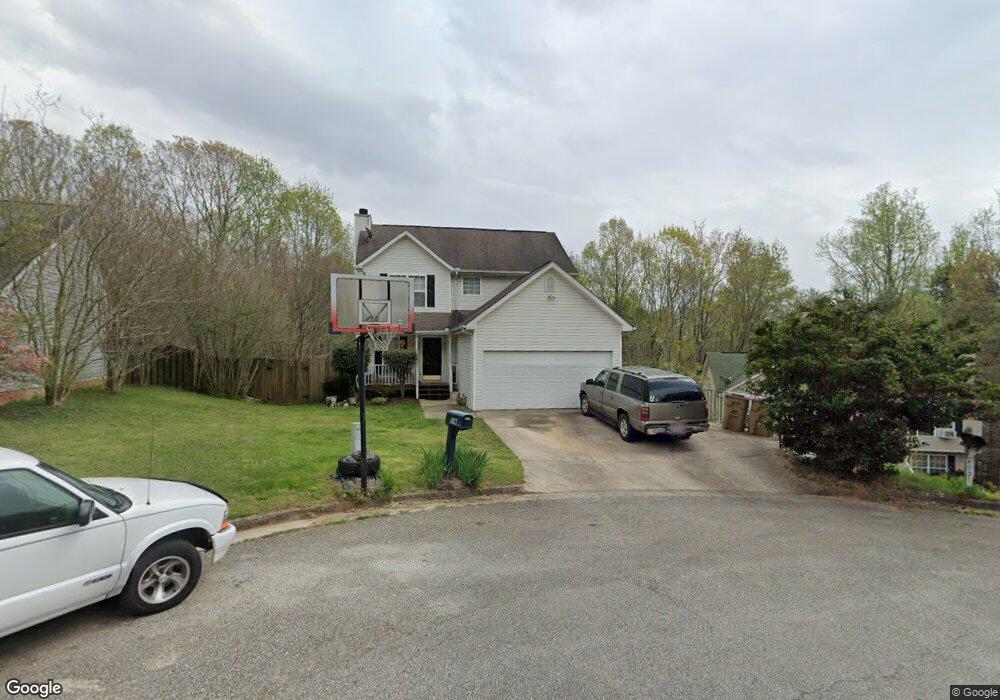
4027 Avalon Place Flowery Branch, GA 30542
Estimated Value: $329,006 - $355,000
3
Beds
2
Baths
1,318
Sq Ft
$262/Sq Ft
Est. Value
About This Home
This home is located at 4027 Avalon Place, Flowery Branch, GA 30542 and is currently estimated at $345,502, approximately $262 per square foot. 4027 Avalon Place is a home located in Hall County with nearby schools including Martin Elementary School, Southwest Middle School, and C.W. Davis Middle School.
Ownership History
Date
Name
Owned For
Owner Type
Purchase Details
Closed on
May 10, 2002
Sold by
Gosdin Thomas W and Gosdin Janice H
Bought by
Shubert Bradley G and Elizabeth M
Current Estimated Value
Home Financials for this Owner
Home Financials are based on the most recent Mortgage that was taken out on this home.
Original Mortgage
$124,450
Outstanding Balance
$52,514
Interest Rate
6.92%
Mortgage Type
New Conventional
Estimated Equity
$292,988
Purchase Details
Closed on
May 1, 2001
Sold by
Washington Mutual Bank Fa
Bought by
Hud
Purchase Details
Closed on
Jul 6, 1998
Sold by
Sunrise Home Builders Inc
Bought by
Harrison Rex W and Harrison Jacque C
Home Financials for this Owner
Home Financials are based on the most recent Mortgage that was taken out on this home.
Original Mortgage
$99,642
Interest Rate
7.02%
Mortgage Type
FHA
Create a Home Valuation Report for This Property
The Home Valuation Report is an in-depth analysis detailing your home's value as well as a comparison with similar homes in the area
Home Values in the Area
Average Home Value in this Area
Purchase History
| Date | Buyer | Sale Price | Title Company |
|---|---|---|---|
| Shubert Bradley G | $131,000 | -- | |
| Hud | -- | -- | |
| Washington Mutual Bank Fa | $103,127 | -- | |
| Washington Mutual Bank | $103,100 | -- | |
| Harrison Rex W | $102,100 | -- |
Source: Public Records
Mortgage History
| Date | Status | Borrower | Loan Amount |
|---|---|---|---|
| Open | Shubert Bradley G | $124,450 | |
| Previous Owner | Harrison Rex W | $99,642 |
Source: Public Records
Tax History Compared to Growth
Tax History
| Year | Tax Paid | Tax Assessment Tax Assessment Total Assessment is a certain percentage of the fair market value that is determined by local assessors to be the total taxable value of land and additions on the property. | Land | Improvement |
|---|---|---|---|---|
| 2024 | $3,020 | $119,200 | $18,560 | $100,640 |
| 2023 | $2,898 | $130,280 | $18,560 | $111,720 |
| 2022 | $2,695 | $101,960 | $16,880 | $85,080 |
| 2021 | $2,348 | $86,920 | $10,840 | $76,080 |
| 2020 | $1,996 | $71,440 | $8,240 | $63,200 |
| 2019 | $1,967 | $69,880 | $8,240 | $61,640 |
| 2018 | $1,681 | $57,440 | $8,240 | $49,200 |
| 2017 | $1,479 | $50,800 | $8,240 | $42,560 |
| 2016 | $1,335 | $46,720 | $8,240 | $38,480 |
| 2015 | $903 | $30,622 | $4,920 | $25,702 |
| 2014 | $903 | $30,622 | $4,920 | $25,702 |
Source: Public Records
Map
Nearby Homes
- 4020 Parks Rd
- 4086 Parks Rd
- 4021 Laurant Path
- 4013 Laurant Path
- Wakehurst Plan at Falls Creek
- 3935 Alderstone Dr
- Sheridan Plan at Falls Creek
- Avera Plan at Falls Creek
- Atwood Plan at Falls Creek
- Trenton Plan at Falls Creek
- Prescott Plan at Falls Creek
- Ingram Plan at Falls Creek
- Fairfield Plan at Falls Creek
- Denton Plan at Falls Creek
- Edison Plan at Falls Creek
- 4054 Alderstone Dr
- 4050 Alderstone Dr
- 4042 Alderstone Dr
- 4003 Warren Rd
- 3987 Alderstone Dr
- 4031 Avalon Place
- 4025 Avalon Place
- 4032 Avalon Place
- 4017 Avalon Place
- 4028 Avalon Place
- 4024 Avalon Place
- 4022 Avalon Place
- 4007 Avalon Place
- 4014 Avalon Place
- 4008 Avalon Place
- 4016 Parks Rd
- 4006 Parks Rd
- 4010 Parks Rd
- 4002 Parks Rd
- 4050 Boulder Place
- 4024 Parks Rd
- 4056 Boulder Place
- 4038 Boulder Place
- 3992 Parks Rd
- 4028 Parks Rd