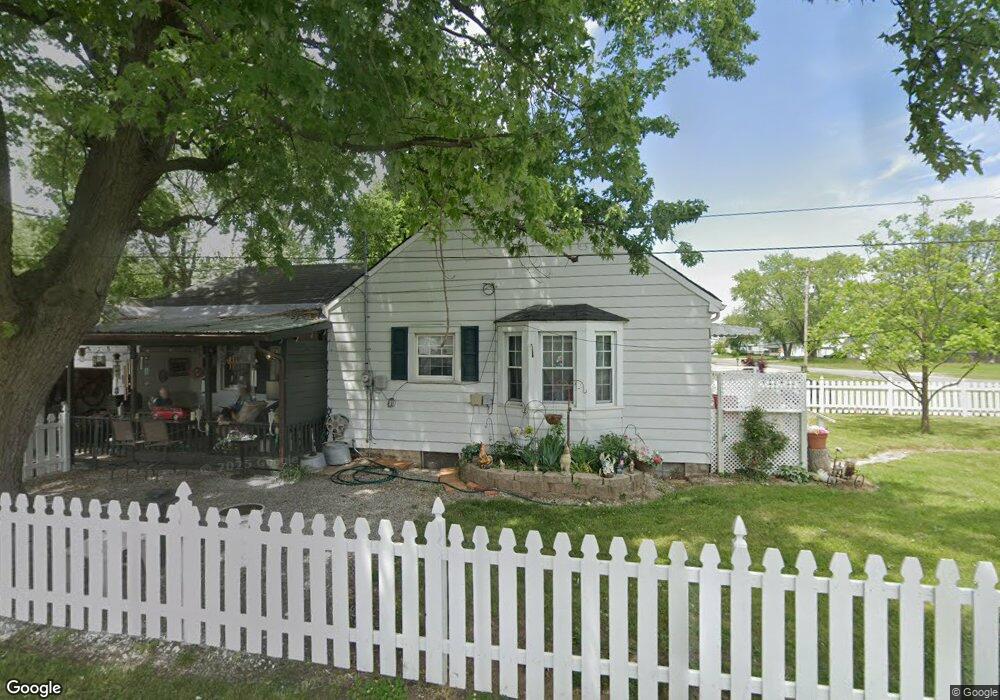
4027 Main St Anderson, IN 46013
Estimated Value: $110,000 - $133,067
2
Beds
1
Bath
1,780
Sq Ft
$70/Sq Ft
Est. Value
About This Home
This home is located at 4027 Main St, Anderson, IN 46013 and is currently estimated at $124,017, approximately $69 per square foot. 4027 Main St is a home located in Madison County with nearby schools including Erskine Elementary School, Highland Middle School, and Anderson High School.
Ownership History
Date
Name
Owned For
Owner Type
Purchase Details
Closed on
Jun 27, 2008
Sold by
Ginder Ruby
Bought by
Wilson Arlene E and Shannon Chayna C
Current Estimated Value
Purchase Details
Closed on
Aug 17, 2007
Sold by
Estate Of Jerry J Burmeister
Bought by
Ginder Ruby
Home Financials for this Owner
Home Financials are based on the most recent Mortgage that was taken out on this home.
Original Mortgage
$55,000
Interest Rate
6.77%
Mortgage Type
New Conventional
Create a Home Valuation Report for This Property
The Home Valuation Report is an in-depth analysis detailing your home's value as well as a comparison with similar homes in the area
Home Values in the Area
Average Home Value in this Area
Purchase History
| Date | Buyer | Sale Price | Title Company |
|---|---|---|---|
| Wilson Arlene E | -- | -- | |
| Ginder Ruby | -- | -- |
Source: Public Records
Mortgage History
| Date | Status | Borrower | Loan Amount |
|---|---|---|---|
| Previous Owner | Ginder Ruby | $55,000 |
Source: Public Records
Tax History Compared to Growth
Tax History
| Year | Tax Paid | Tax Assessment Tax Assessment Total Assessment is a certain percentage of the fair market value that is determined by local assessors to be the total taxable value of land and additions on the property. | Land | Improvement |
|---|---|---|---|---|
| 2024 | $755 | $71,500 | $11,600 | $59,900 |
| 2023 | $708 | $65,500 | $11,000 | $54,500 |
| 2022 | $703 | $65,200 | $10,400 | $54,800 |
| 2021 | $649 | $60,100 | $10,300 | $49,800 |
| 2020 | $621 | $57,400 | $9,800 | $47,600 |
| 2019 | $922 | $56,100 | $9,800 | $46,300 |
| 2018 | $572 | $52,100 | $9,800 | $42,300 |
| 2017 | $522 | $51,400 | $9,800 | $41,600 |
| 2016 | $522 | $51,400 | $9,800 | $41,600 |
| 2014 | $539 | $53,300 | $9,800 | $43,500 |
| 2013 | $539 | $53,300 | $9,800 | $43,500 |
Source: Public Records
Map
Nearby Homes