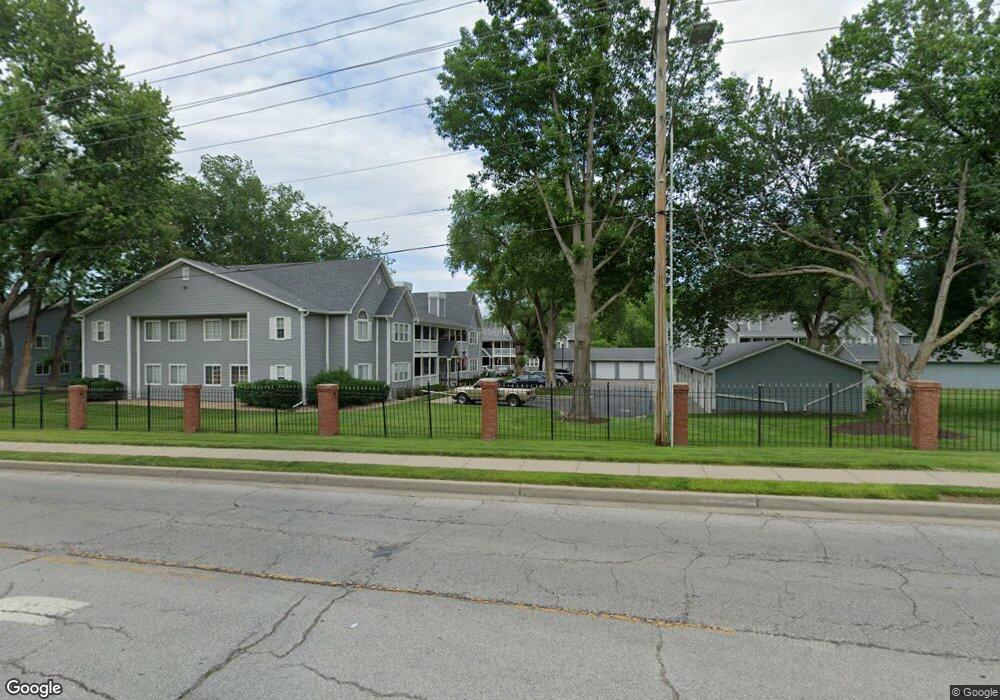
4027 S Crysler Ave Unit 81 Independence, MO 64055
Luff NeighborhoodEstimated Value: $148,000 - $155,000
2
Beds
2
Baths
1,288
Sq Ft
$119/Sq Ft
Est. Value
About This Home
This home is located at 4027 S Crysler Ave Unit 81, Independence, MO 64055 and is currently estimated at $153,103, approximately $118 per square foot. 4027 S Crysler Ave Unit 81 is a home located in Jackson County with nearby schools including John W. Luff Elementary School, Bridger Middle School, and Pioneer Ridge Middle School.
Ownership History
Date
Name
Owned For
Owner Type
Purchase Details
Closed on
Oct 29, 2018
Sold by
Barnard William H and Barnard Mary Anne M
Bought by
Ganote Joseph C and Ganote Marilyn L
Current Estimated Value
Home Financials for this Owner
Home Financials are based on the most recent Mortgage that was taken out on this home.
Original Mortgage
$89,100
Outstanding Balance
$77,866
Interest Rate
4.6%
Mortgage Type
New Conventional
Estimated Equity
$75,237
Purchase Details
Closed on
Feb 5, 2009
Sold by
Buchanan Melba Morgan and Pedersen Fern
Bought by
Barnard William H and Barnard Maryanne M
Home Financials for this Owner
Home Financials are based on the most recent Mortgage that was taken out on this home.
Original Mortgage
$68,400
Interest Rate
5.17%
Mortgage Type
Purchase Money Mortgage
Purchase Details
Closed on
Oct 18, 1996
Sold by
Morgan Louis F and Morgan Melba
Bought by
Morgan Mark E and Morgan Kathy J
Create a Home Valuation Report for This Property
The Home Valuation Report is an in-depth analysis detailing your home's value as well as a comparison with similar homes in the area
Home Values in the Area
Average Home Value in this Area
Purchase History
| Date | Buyer | Sale Price | Title Company |
|---|---|---|---|
| Ganote Joseph C | -- | None Available | |
| Barnard William H | -- | Heart Of America Title & Esc | |
| Morgan Mark E | -- | -- |
Source: Public Records
Mortgage History
| Date | Status | Borrower | Loan Amount |
|---|---|---|---|
| Open | Ganote Joseph C | $89,100 | |
| Previous Owner | Barnard William H | $68,400 |
Source: Public Records
Tax History Compared to Growth
Tax History
| Year | Tax Paid | Tax Assessment Tax Assessment Total Assessment is a certain percentage of the fair market value that is determined by local assessors to be the total taxable value of land and additions on the property. | Land | Improvement |
|---|---|---|---|---|
| 2025 | $1,424 | $23,630 | $209 | $23,421 |
| 2024 | $1,391 | $20,549 | $923 | $19,626 |
| 2023 | $1,391 | $20,549 | $2,233 | $18,316 |
| 2022 | $1,347 | $18,240 | $951 | $17,289 |
| 2021 | $1,347 | $18,240 | $951 | $17,289 |
| 2020 | $1,209 | $15,905 | $951 | $14,954 |
| 2019 | $1,189 | $15,905 | $951 | $14,954 |
| 2018 | $879,081 | $12,937 | $951 | $11,986 |
| 2017 | $1,008 | $12,937 | $951 | $11,986 |
| 2016 | $1,008 | $12,746 | $951 | $11,795 |
| 2014 | $887 | $11,457 | $951 | $10,506 |
Source: Public Records
Map
Nearby Homes
- 4005 S Crysler Ave Unit 10
- 4007 S Crysler Ave Unit 5
- 4007 S Crysler Ave Unit 6
- 4007 S Crysler Ave Unit 8
- 4009 S Crysler Ave Unit 38 apt 2
- 4004 S Fuller Ave
- 3840 S Crysler Ave
- 12613 E 41st Terrace S
- 12621 E 41st Terrace S
- 12805 E 40th Terrace S
- 4014 S Forest Ave
- 3800 S Crysler Ave
- 12310 E 43rd St S Unit B10
- 11710 E 40th St S
- 3705 S Marion Ct
- 3729 S Fuller Ave
- 12800 E 38th St S
- 3921 S Delaware Ave
- 4204 S Mccoy St
- 4013 Crestview Rd
- 4027 S Crysler Ave Unit 1
- 4027 S Crysler Ave Unit 7
- 4027 S Crysler Ave Unit 4
- 4027 S Crysler Ave Unit 5
- 4027 S Crysler Ave Unit 83
- 4027 S Crysler Ave Unit 82
- 4027 S Crysler Ave Unit 8
- 4027 S Crysler Ave Unit 84
- 4027 S Crysler Ave Unit 88
- 4027 S Crysler Ave Unit 85
- 4027 S Crysler Ave Unit 86
- 4027 S Crysler Ave Unit 87
- 4027 S Crysler Ave
- 4027 S Crysler Ave Unit 3
- 4027 S Crysler #6 St Unit 6
- 4027 S Crysler #8 Ave Unit 8
- 4027 S Crysler Ave
- 4029 S Crysler Ave
- 4029 S Crysler Ave
- 4029 S Crysler Ave Unit 5