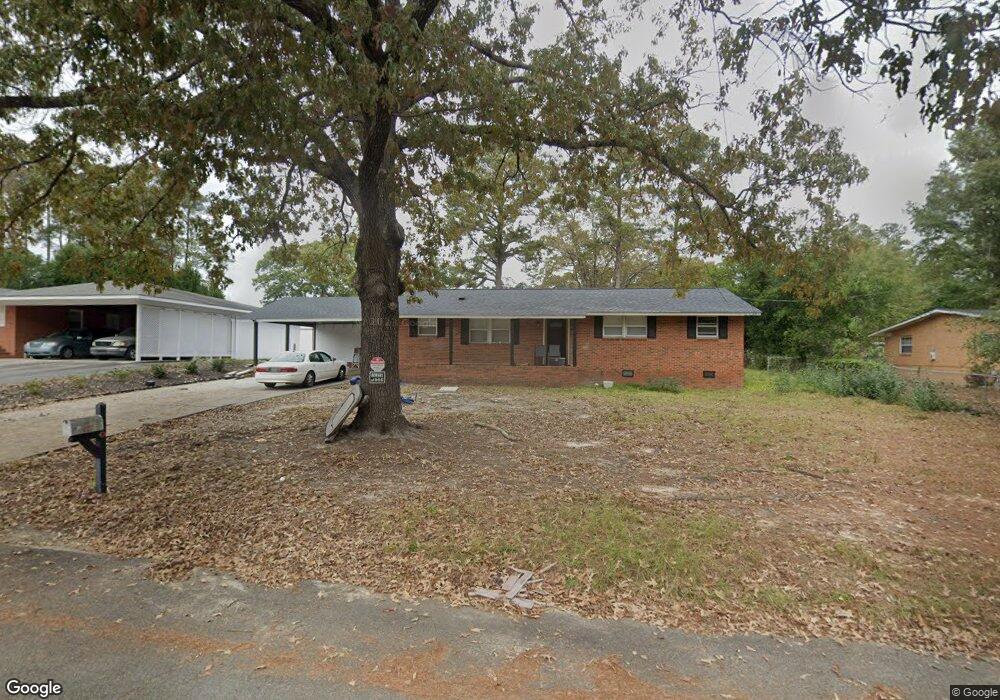
4027 Woodburn St Augusta, GA 30907
Estimated Value: $197,000 - $242,000
3
Beds
2
Baths
1,369
Sq Ft
$166/Sq Ft
Est. Value
About This Home
This home is located at 4027 Woodburn St, Augusta, GA 30907 and is currently estimated at $227,267, approximately $166 per square foot. 4027 Woodburn St is a home located in Columbia County with nearby schools including Northmore Elementary School, Martinez Elementary School, and Roosevelt Middle School.
Ownership History
Date
Name
Owned For
Owner Type
Purchase Details
Closed on
Aug 28, 2019
Sold by
Suntrust Bank
Bought by
Telamont Llc
Current Estimated Value
Purchase Details
Closed on
Jun 4, 2019
Sold by
Hartness Melanie A
Bought by
Suntrust Bank
Purchase Details
Closed on
Apr 22, 2011
Sold by
Sec Of Housing & U
Bought by
Hartness Melanie
Home Financials for this Owner
Home Financials are based on the most recent Mortgage that was taken out on this home.
Original Mortgage
$80,699
Interest Rate
4.87%
Mortgage Type
FHA
Purchase Details
Closed on
Oct 5, 2010
Sold by
Citimortgage Inc
Bought by
Sec Dept Of Housing
Purchase Details
Closed on
Feb 28, 2007
Sold by
Inglett Richard D
Bought by
Deas Donald K
Home Financials for this Owner
Home Financials are based on the most recent Mortgage that was taken out on this home.
Original Mortgage
$106,473
Interest Rate
6.3%
Mortgage Type
FHA
Create a Home Valuation Report for This Property
The Home Valuation Report is an in-depth analysis detailing your home's value as well as a comparison with similar homes in the area
Home Values in the Area
Average Home Value in this Area
Purchase History
| Date | Buyer | Sale Price | Title Company |
|---|---|---|---|
| Telamont Llc | $78,611 | -- | |
| Suntrust Bank | $78,611 | -- | |
| Hartness Melanie | $80,000 | -- | |
| Sec Dept Of Housing | -- | -- | |
| Deas Donald K | $124,900 | -- |
Source: Public Records
Mortgage History
| Date | Status | Borrower | Loan Amount |
|---|---|---|---|
| Previous Owner | Hartness Melanie | $80,699 | |
| Previous Owner | Deas Donald K | $106,473 |
Source: Public Records
Tax History Compared to Growth
Tax History
| Year | Tax Paid | Tax Assessment Tax Assessment Total Assessment is a certain percentage of the fair market value that is determined by local assessors to be the total taxable value of land and additions on the property. | Land | Improvement |
|---|---|---|---|---|
| 2025 | $2,364 | $96,660 | $17,204 | $79,456 |
| 2024 | $2,438 | $95,214 | $15,604 | $79,610 |
| 2023 | $2,438 | $80,995 | $15,604 | $65,391 |
| 2022 | $2,012 | $75,158 | $11,504 | $63,654 |
| 2021 | $990 | $34,239 | $10,804 | $23,435 |
| 2020 | $853 | $28,581 | $9,804 | $18,777 |
| 2019 | $1,260 | $43,247 | $9,304 | $33,943 |
| 2018 | $1,228 | $41,962 | $8,604 | $33,358 |
| 2017 | $1,253 | $42,711 | $7,804 | $34,907 |
| 2016 | $1,157 | $40,720 | $7,568 | $33,152 |
| 2015 | $1,264 | $44,598 | $8,168 | $36,430 |
| 2014 | $1,273 | $44,381 | $8,768 | $35,613 |
Source: Public Records
Map
Nearby Homes
- 4022 Tallman Dr
- 242 Maywood Dr
- 214 Maywood Dr
- 4067 Flintrock Way
- 4178 Heathcliff Dr
- 262 Indian Creek Rd
- 4179 Heathcliff Dr
- 3973 Concord Place
- 272 Hinman Dr
- 3921 Miramar Drive Extension
- 3959 Braddock St
- 255 Settlement Rd
- 4212 Knollcrest Cir S
- 116 Springlakes Dr
- 207 Caribe Dr
- 3927 Mack Rd
- 3924 Old Trail Rd
- 0 Settlement Rd
- 110 Redbud Ln
- 4007 Horseshoe Rd
- 4029 Woodburn St
- 4025 Woodburn St
- 4026 Tallman Dr
- 4028 Tallman Dr
- 4031 Woodburn St
- 4023 Woodburn St
- 4030 Woodburn St
- 4028 Woodburn St
- 4024 Tallman Dr
- 4030 Tallman Dr
- 4026 Woodburn St
- 4033 Woodburn St
- 231 Elgin Dr
- 234 Kensington St
- 4024 Woodburn St
- 233 Elgin Dr
- 4032 Tallman Dr
- 4032 Woodburn St
- 4027 Tallman Dr
- 4022 Woodburn St