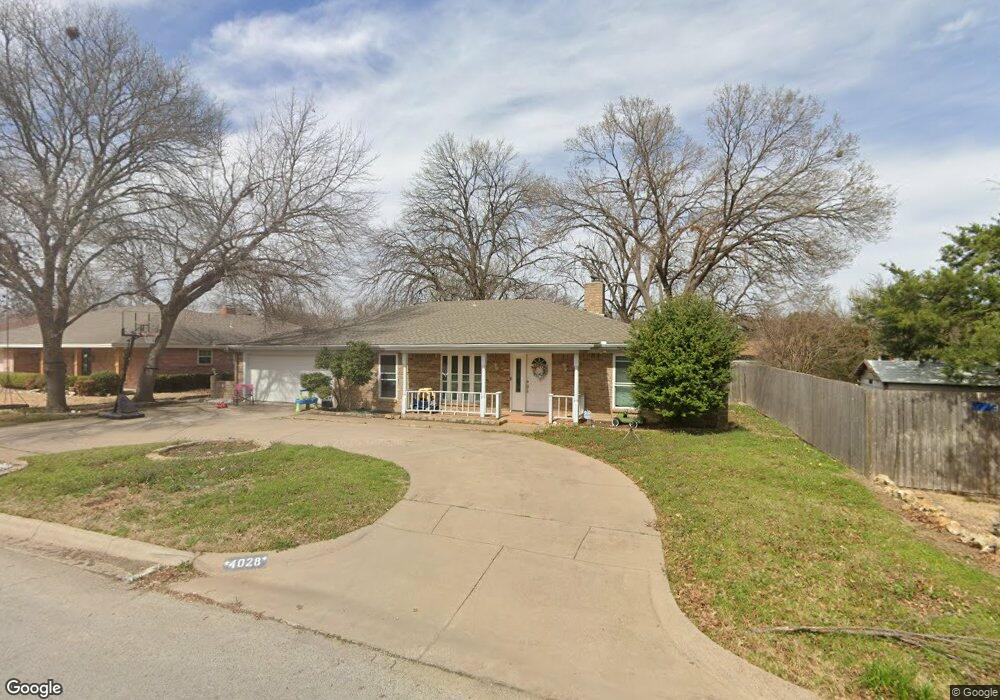
4028 Alava Dr Fort Worth, TX 76133
Wedgwood NeighborhoodEstimated Value: $301,006 - $343,000
3
Beds
2
Baths
2,158
Sq Ft
$153/Sq Ft
Est. Value
About This Home
This home is located at 4028 Alava Dr, Fort Worth, TX 76133 and is currently estimated at $329,502, approximately $152 per square foot. 4028 Alava Dr is a home located in Tarrant County with nearby schools including Woodway Elementary School, Wedgwood Middle School, and Wedgwood Sixth Grade Center.
Ownership History
Date
Name
Owned For
Owner Type
Purchase Details
Closed on
Jun 16, 2015
Sold by
Flynn Mike and Flynn Michael Timothy
Bought by
Martinez Matthew L and Martinez Adrienne
Current Estimated Value
Home Financials for this Owner
Home Financials are based on the most recent Mortgage that was taken out on this home.
Original Mortgage
$147,250
Outstanding Balance
$114,333
Interest Rate
3.82%
Mortgage Type
New Conventional
Estimated Equity
$215,169
Purchase Details
Closed on
Nov 14, 2006
Sold by
Flynn Robin and Flynn Robin Meredith
Bought by
Flynn Mike and Flynn Michael Timothy
Purchase Details
Closed on
May 21, 2003
Sold by
Saunders Alan C and Saunders Lois P
Bought by
Flynn Mike and Flynn Robin
Home Financials for this Owner
Home Financials are based on the most recent Mortgage that was taken out on this home.
Original Mortgage
$135,850
Interest Rate
5.84%
Mortgage Type
Purchase Money Mortgage
Create a Home Valuation Report for This Property
The Home Valuation Report is an in-depth analysis detailing your home's value as well as a comparison with similar homes in the area
Home Values in the Area
Average Home Value in this Area
Purchase History
| Date | Buyer | Sale Price | Title Company |
|---|---|---|---|
| Martinez Matthew L | -- | None Available | |
| Flynn Mike | -- | None Available | |
| Flynn Mike | -- | Alamo Title Company |
Source: Public Records
Mortgage History
| Date | Status | Borrower | Loan Amount |
|---|---|---|---|
| Open | Martinez Matthew L | $147,250 | |
| Previous Owner | Flynn Mike | $135,850 | |
| Closed | Flynn Mike | $0 |
Source: Public Records
Tax History Compared to Growth
Tax History
| Year | Tax Paid | Tax Assessment Tax Assessment Total Assessment is a certain percentage of the fair market value that is determined by local assessors to be the total taxable value of land and additions on the property. | Land | Improvement |
|---|---|---|---|---|
| 2025 | $3,963 | $247,159 | $45,000 | $202,159 |
| 2024 | $3,963 | $247,159 | $45,000 | $202,159 |
| 2023 | $5,357 | $236,736 | $45,000 | $191,736 |
| 2022 | $5,802 | $225,847 | $45,000 | $180,847 |
| 2021 | $5,566 | $202,893 | $45,000 | $157,893 |
| 2020 | $5,718 | $216,020 | $45,000 | $171,020 |
| 2019 | $5,702 | $236,314 | $45,000 | $191,314 |
| 2018 | $5,270 | $191,570 | $35,000 | $156,570 |
| 2017 | $4,853 | $171,305 | $35,000 | $136,305 |
| 2016 | $4,437 | $156,624 | $35,000 | $121,624 |
| 2015 | $3,699 | $146,100 | $18,000 | $128,100 |
| 2014 | $3,699 | $146,100 | $18,000 | $128,100 |
Source: Public Records
Map
Nearby Homes
- 4021 Aragon Dr
- 6709 Santiago Ave
- 4032 Aragon Dr
- 4021 Toledo Ave
- 6809 Welch Ave
- 6404 San Juan Ave
- 3901 Willow Way Rd
- 3809 Misty Meadow Dr
- 6800 Welch Ave
- 3817 Misty Meadow Dr
- 4225 Capilla St
- 3753 Misty Meadow Dr
- 4255 Cadiz Dr
- 3913 Misty Meadow Dr
- 6758 Cartagena Ct
- 3925 Wedgworth Rd S
- 4313 Barcelona Dr
- 7000 Santa Rita Ct
- 6905 W Cleburne Rd
- 6817 W Cleburne Rd