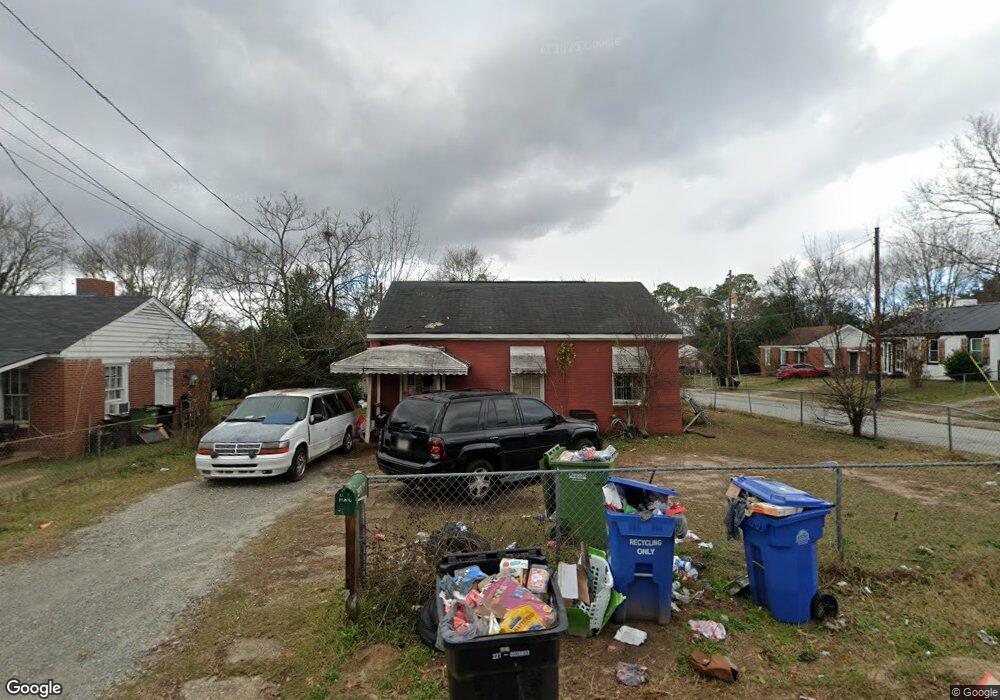
4029 6th Ave Columbus, GA 31904
North Highlands NeighborhoodEstimated Value: $63,000 - $97,594
2
Beds
1
Bath
725
Sq Ft
$103/Sq Ft
Est. Value
About This Home
This home is located at 4029 6th Ave, Columbus, GA 31904 and is currently estimated at $74,649, approximately $102 per square foot. 4029 6th Ave is a home located in Muscogee County with nearby schools including Fox Elementary School, Double Churches Middle School, and Jordan Vocational High School.
Ownership History
Date
Name
Owned For
Owner Type
Purchase Details
Closed on
Dec 23, 2013
Sold by
Home Investments Inc
Bought by
Ric Mark Properties Llc
Current Estimated Value
Purchase Details
Closed on
Jul 30, 2009
Sold by
Holloway Jeffery W
Bought by
Home Investments Inc
Purchase Details
Closed on
Oct 7, 2008
Sold by
Regions Bank
Bought by
Federal Home Loan Mortgage Corp
Create a Home Valuation Report for This Property
The Home Valuation Report is an in-depth analysis detailing your home's value as well as a comparison with similar homes in the area
Home Values in the Area
Average Home Value in this Area
Purchase History
| Date | Buyer | Sale Price | Title Company |
|---|---|---|---|
| Ric Mark Properties Llc | $20,000 | -- | |
| Home Investments Inc | $22,000 | None Available | |
| Holloway Jeffrey W | -- | None Available | |
| Federal Home Loan Mortgage Corp | -- | None Available | |
| Regions Bank | $25,392 | None Available |
Source: Public Records
Tax History Compared to Growth
Tax History
| Year | Tax Paid | Tax Assessment Tax Assessment Total Assessment is a certain percentage of the fair market value that is determined by local assessors to be the total taxable value of land and additions on the property. | Land | Improvement |
|---|---|---|---|---|
| 2025 | $746 | $19,048 | $5,428 | $13,620 |
| 2024 | $746 | $19,048 | $5,428 | $13,620 |
| 2023 | $306 | $16,959 | $5,428 | $11,531 |
| 2022 | $407 | $9,972 | $3,800 | $6,172 |
| 2021 | $291 | $7,132 | $3,800 | $3,332 |
| 2020 | $291 | $7,132 | $3,800 | $3,332 |
| 2019 | $406 | $9,900 | $2,475 | $7,425 |
| 2018 | $406 | $9,900 | $2,475 | $7,425 |
| 2017 | $407 | $9,900 | $2,475 | $7,425 |
| 2016 | $510 | $12,352 | $1,503 | $10,849 |
| 2015 | $510 | $12,352 | $1,503 | $10,849 |
| 2014 | $511 | $12,352 | $1,503 | $10,849 |
| 2013 | -- | $12,352 | $1,503 | $10,849 |
Source: Public Records
Map
Nearby Homes