Estimated Value: $494,000 - $595,000
--
Bed
3
Baths
2,725
Sq Ft
$198/Sq Ft
Est. Value
About This Home
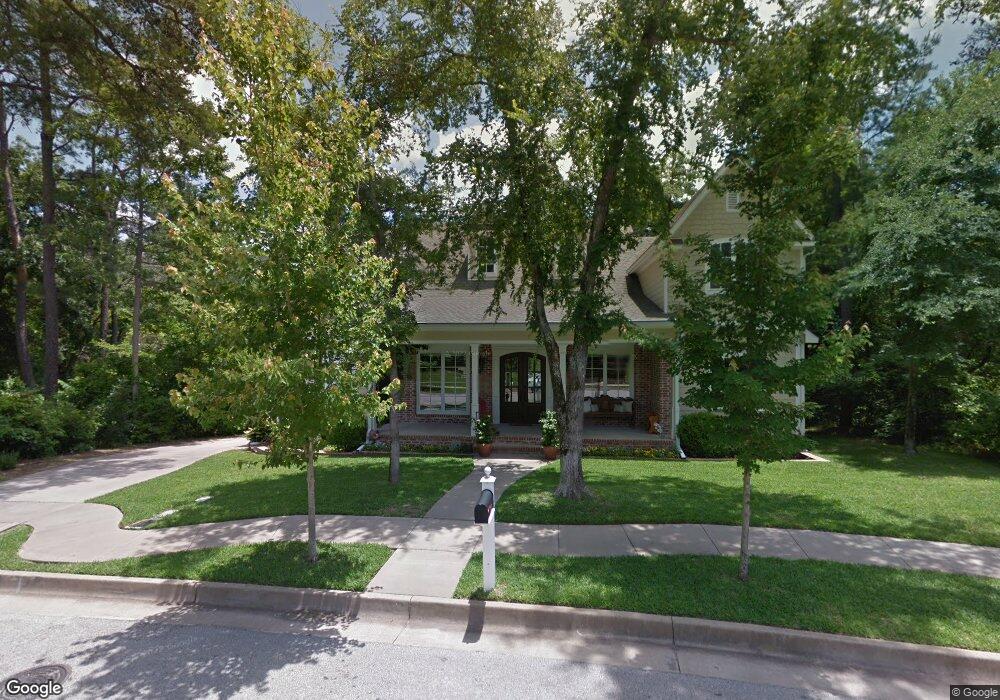
This home is located at 4029 Charleston Park, Tyler, TX 75701 and is currently estimated at $540,085, approximately $198 per square foot. 4029 Charleston Park is a home located in Smith County with nearby schools including Kissam Intermediate School, Jackson Elementary School, and Chapel Hill Middle School.
Ownership History
Date
Name
Owned For
Owner Type
Purchase Details
Closed on
Aug 17, 2011
Sold by
Conner Chandler Ross and Conner Stacy Adams
Bought by
Danielson Guy O and Stillwell Sheri Kay
Current Estimated Value
Home Financials for this Owner
Home Financials are based on the most recent Mortgage that was taken out on this home.
Original Mortgage
$308,000
Outstanding Balance
$23,126
Interest Rate
4.53%
Mortgage Type
New Conventional
Estimated Equity
$516,959
Purchase Details
Closed on
Jun 7, 2005
Sold by
Charleston Park Llc
Bought by
Conner Communities Inc
Home Financials for this Owner
Home Financials are based on the most recent Mortgage that was taken out on this home.
Original Mortgage
$35,550
Interest Rate
5.78%
Mortgage Type
Purchase Money Mortgage
Create a Home Valuation Report for This Property
The Home Valuation Report is an in-depth analysis detailing your home's value as well as a comparison with similar homes in the area
Home Values in the Area
Average Home Value in this Area
Purchase History
| Date | Buyer | Sale Price | Title Company |
|---|---|---|---|
| Danielson Guy O | -- | None Available | |
| Conner Communities Inc | -- | None Available |
Source: Public Records
Mortgage History
| Date | Status | Borrower | Loan Amount |
|---|---|---|---|
| Open | Danielson Guy O | $308,000 | |
| Previous Owner | Conner Communities Inc | $35,550 |
Source: Public Records
Tax History Compared to Growth
Tax History
| Year | Tax Paid | Tax Assessment Tax Assessment Total Assessment is a certain percentage of the fair market value that is determined by local assessors to be the total taxable value of land and additions on the property. | Land | Improvement |
|---|---|---|---|---|
| 2025 | $3,977 | $568,175 | $42,360 | $525,815 |
| 2024 | $3,977 | $528,216 | $44,100 | $531,428 |
| 2023 | $9,067 | $568,580 | $44,100 | $524,480 |
| 2022 | $7,859 | $436,542 | $44,100 | $392,442 |
| 2021 | $7,763 | $410,098 | $44,100 | $365,998 |
| 2020 | $7,602 | $389,681 | $44,100 | $345,581 |
| 2019 | $7,610 | $378,278 | $44,100 | $334,178 |
| 2018 | $7,418 | $370,928 | $36,750 | $334,178 |
| 2017 | $7,418 | $370,928 | $36,750 | $334,178 |
| 2016 | $7,236 | $361,829 | $36,750 | $325,079 |
| 2015 | $6,324 | $355,811 | $36,750 | $319,061 |
| 2014 | $6,324 | $347,718 | $36,750 | $310,968 |
Source: Public Records
Map
Nearby Homes
- 4024 Hanover Place
- 4029 Hanover Place
- 4025 Hanover Place
- 4021 Hanover Place
- 3962 Hanover Place
- 4037 Hanover Place
- 3950 Hanover Place
- 3913 Belle Mere St
- 2527 Westminster Dr
- 2613 Chelsea Dr
- 8226 County Road 219
- 8217 County Road 219
- 3606 Trailwood Ct
- 10130 State Highway 64 E
- 3618 Trailwood Ct
- 2216 Gish Ln
- 3858 Broadmoore Ct
- 00 County Road 2209
- 3617 Flagstone Dr
- 3109 Campus Cir
- 4025 Charleston Park
- 4033 Charleston Park
- 4024 Charleston Park
- 4037 Charleston Park
- 4024 4024 Charleston Park
- 4019 Spartanburg
- 4020 Charleston Park
- 4015 Spartanburg
- 4041 Charleston Park
- 2906 2906 Savannah Creek
- 4011 Spartanburg
- 4016 Charleston Park
- 4045 Charleston Park
- 4028 Hanover Place
- 4032 Hanover Place
- 4007 4007 Spartanburg Ln
- 4048 Charleston Park
- 4012 Charleston Park
- 4036 Hanover Place
- 4040 Hanover Place