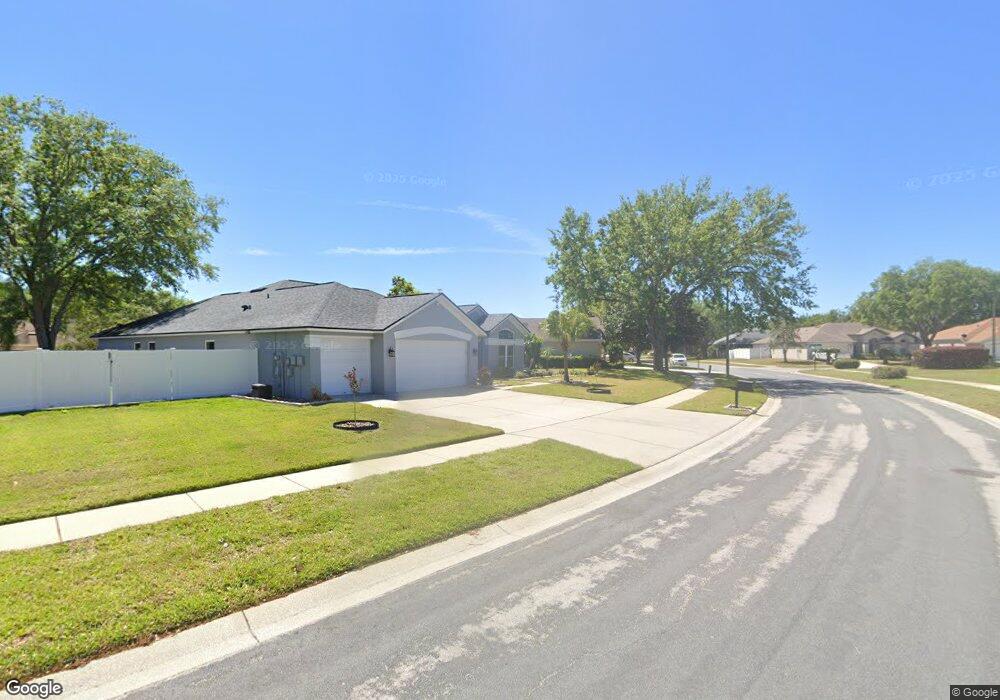
4029 Lithia Ridge Blvd Valrico, FL 33596
Estimated Value: $527,533 - $560,000
4
Beds
3
Baths
2,477
Sq Ft
$219/Sq Ft
Est. Value
About This Home
This home is located at 4029 Lithia Ridge Blvd, Valrico, FL 33596 and is currently estimated at $543,383, approximately $219 per square foot. 4029 Lithia Ridge Blvd is a home located in Hillsborough County with nearby schools including Lithia Springs Elementary School, Randall Middle School, and Newsome High School.
Ownership History
Date
Name
Owned For
Owner Type
Purchase Details
Closed on
Apr 4, 2008
Sold by
Pittelli Victor A and Pittelli Constance C
Bought by
Wells Forest C and Wells Faith A
Current Estimated Value
Home Financials for this Owner
Home Financials are based on the most recent Mortgage that was taken out on this home.
Original Mortgage
$275,318
Outstanding Balance
$174,948
Interest Rate
6.03%
Mortgage Type
FHA
Estimated Equity
$368,435
Purchase Details
Closed on
Jul 25, 2001
Sold by
Engstrom Charles L and Engstrom G
Bought by
Pitteitt Victor A and Pitteitt Constance C
Purchase Details
Closed on
Aug 26, 1996
Sold by
Ih Tampa Homes Corp
Bought by
Engstrom Charles L and Engstrom Susan G
Home Financials for this Owner
Home Financials are based on the most recent Mortgage that was taken out on this home.
Original Mortgage
$155,244
Interest Rate
8.4%
Mortgage Type
VA
Create a Home Valuation Report for This Property
The Home Valuation Report is an in-depth analysis detailing your home's value as well as a comparison with similar homes in the area
Home Values in the Area
Average Home Value in this Area
Purchase History
| Date | Buyer | Sale Price | Title Company |
|---|---|---|---|
| Wells Forest C | $277,500 | Southern Title Hldg Co Llc | |
| Pitteitt Victor A | $190,000 | -- | |
| Engstrom Charles L | $170,000 | -- |
Source: Public Records
Mortgage History
| Date | Status | Borrower | Loan Amount |
|---|---|---|---|
| Open | Wells Forest C | $275,318 | |
| Previous Owner | Engstrom Charles L | $155,244 |
Source: Public Records
Tax History Compared to Growth
Tax History
| Year | Tax Paid | Tax Assessment Tax Assessment Total Assessment is a certain percentage of the fair market value that is determined by local assessors to be the total taxable value of land and additions on the property. | Land | Improvement |
|---|---|---|---|---|
| 2024 | $4,027 | $234,417 | -- | -- |
| 2023 | $3,878 | $227,589 | $0 | $0 |
| 2022 | $3,684 | $220,960 | $0 | $0 |
| 2021 | $3,626 | $214,524 | $0 | $0 |
| 2020 | $3,534 | $211,562 | $0 | $0 |
| 2019 | $3,426 | $206,805 | $0 | $0 |
| 2018 | $3,330 | $202,949 | $0 | $0 |
| 2017 | $3,283 | $243,322 | $0 | $0 |
| 2016 | $3,474 | $194,687 | $0 | $0 |
| 2015 | $3,510 | $193,334 | $0 | $0 |
| 2014 | $3,484 | $191,800 | $0 | $0 |
| 2013 | -- | $188,966 | $0 | $0 |
Source: Public Records
Map
Nearby Homes
- 4506 Gentrice Dr
- 3821 Turkey Oak Dr
- 4902 Jenni Lin Ct
- 4416 Gentrice Dr
- 5205 Fairway One Dr
- 4949 Willow Ridge Terrace
- 5203 Culasaja Cir
- 4723 Bloomingdale Ave
- 3509 Country Creek Ln
- 3522 Autumn Glen Dr
- 3512 Autumn Glen Dr
- Lot #2 Coconut Cove Place
- 4310 Lithia Pinecrest Rd
- 0 Coconut Cove Place
- 4405 Coconut Cove Place
- 4411 Rose St
- 3419 Pearson Rd
- 4538 Foley Grove Dr
- 4592 Foley Grove Dr
- 1240 & 1244 Bloomingdale Ave
- 4027 Lithia Ridge Blvd
- 4033 Lithia Ridge Blvd
- 4525 Gentrice Dr
- 3818 Triple Jump St
- 4025 Lithia Ridge Blvd
- 4030 Lithia Ridge Blvd
- 4035 Lithia Ridge Blvd
- 4032 Lithia Ridge Blvd
- 4521 Gentrice Dr
- 4527 Gentrice Dr
- 4034 Lithia Ridge Blvd
- 3814 Triple Jump St
- 3819 Triple Jump St
- 4023 Lithia Ridge Blvd
- 4036 Lithia Ridge Blvd
- 4037 Lithia Ridge Blvd
- 4519 Gentrice Dr
- 4529 Gentrice Dr
- 4524 Gentrice Dr
- 3812 Triple Jump St