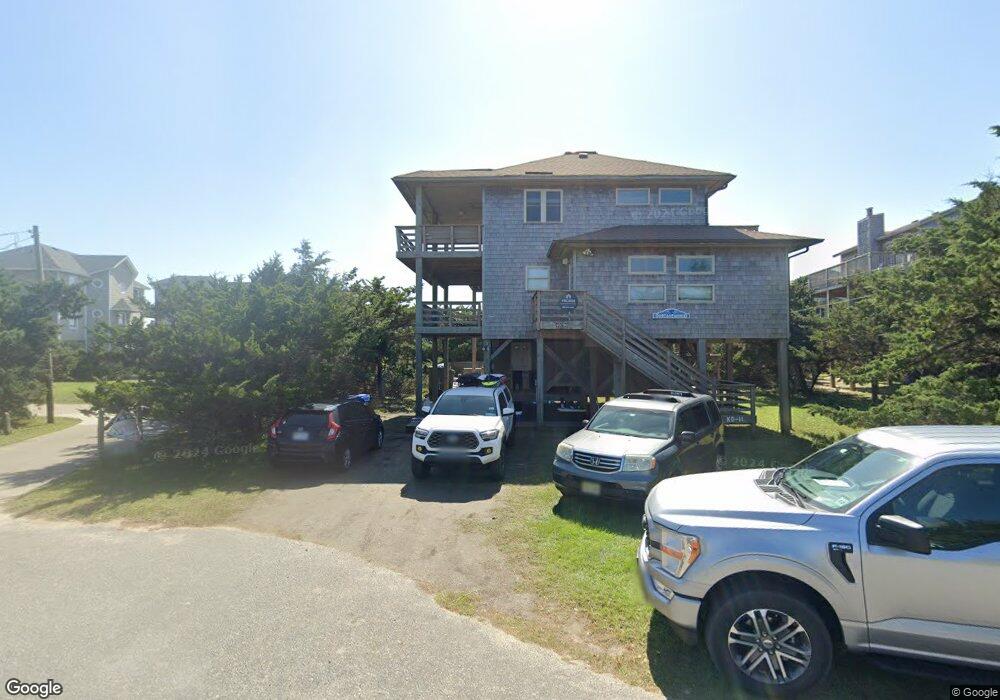
40290 Dune Way Unit 11 Avon, NC 27915
Estimated Value: $477,000 - $575,000
4
Beds
2
Baths
1,532
Sq Ft
$348/Sq Ft
Est. Value
About This Home
This home is located at 40290 Dune Way Unit 11, Avon, NC 27915 and is currently estimated at $533,257, approximately $348 per square foot. 40290 Dune Way Unit 11 is a home located in Dare County with nearby schools including Cape Hatteras Elementary School and Cape Hatteras Secondary School.
Ownership History
Date
Name
Owned For
Owner Type
Purchase Details
Closed on
Feb 23, 2018
Sold by
Leblanc Brian H and Leblanc Tina M
Bought by
Leblanc Ft
Current Estimated Value
Purchase Details
Closed on
Feb 9, 2010
Sold by
Cagwin Daniel and Cagwin Nicole C
Bought by
Leblanc Brian H and Leblanc Tina M
Home Financials for this Owner
Home Financials are based on the most recent Mortgage that was taken out on this home.
Original Mortgage
$243,200
Interest Rate
5.07%
Mortgage Type
New Conventional
Purchase Details
Closed on
Sep 12, 2005
Sold by
Tinsley Forest E and Tinsley Janet
Bought by
Cagwin Daniel and Cagwin Nicole C
Home Financials for this Owner
Home Financials are based on the most recent Mortgage that was taken out on this home.
Original Mortgage
$492,000
Interest Rate
5.77%
Mortgage Type
New Conventional
Create a Home Valuation Report for This Property
The Home Valuation Report is an in-depth analysis detailing your home's value as well as a comparison with similar homes in the area
Home Values in the Area
Average Home Value in this Area
Purchase History
| Date | Buyer | Sale Price | Title Company |
|---|---|---|---|
| Leblanc Ft | -- | -- | |
| Leblanc Brian H | $304,000 | None Available | |
| Cagwin Daniel | $615,000 | None Available |
Source: Public Records
Mortgage History
| Date | Status | Borrower | Loan Amount |
|---|---|---|---|
| Previous Owner | Leblanc Brian H | $243,200 | |
| Previous Owner | Cagwin Daniel | $492,000 |
Source: Public Records
Tax History Compared to Growth
Tax History
| Year | Tax Paid | Tax Assessment Tax Assessment Total Assessment is a certain percentage of the fair market value that is determined by local assessors to be the total taxable value of land and additions on the property. | Land | Improvement |
|---|---|---|---|---|
| 2025 | $2,904 | $496,300 | $167,700 | $328,600 |
| 2024 | $2,940 | $346,000 | $149,800 | $196,200 |
| 2023 | $2,934 | $353,848 | $149,800 | $204,048 |
| 2022 | $2,898 | $353,848 | $149,800 | $204,048 |
| 2021 | $2,863 | $353,848 | $149,800 | $204,048 |
| 2020 | $1,973 | $353,848 | $149,800 | $204,048 |
| 2019 | $2,135 | $321,600 | $176,700 | $144,900 |
| 2018 | $2,135 | $321,600 | $176,700 | $144,900 |
| 2017 | $2,135 | $321,600 | $176,700 | $144,900 |
| 2016 | $2,003 | $321,600 | $176,700 | $144,900 |
| 2014 | $2,007 | $321,600 | $176,700 | $144,900 |
Source: Public Records
Map
Nearby Homes
- 40830 Nc 12 Hwy Unit Lot 1
- 40228 E Sunfish Ct Unit Lot 20
- 41057 Nc Highway 12 Unit 16
- 41057 Nc 12 Hwy Unit 12
- 40268 E Sunfish Ct Unit Lot 17
- 0 E Kinnakeet Reef Ct Unit lot 13 R
- 40247 Croaker Ct Unit Lot K
- 40329 Croaker Ct Unit Lot G
- 41109 Villa Dr
- 41237 Ocean View Dr Unit Lot 6
- 41110 Big Kinnakeet Dr
- 40088 Harbor Rd
- 40196 Leslie Ln Unit Lot 23
- 40308 Due Rd E Unit Lot 15
- 41161 Keel Ct Unit Lot 901
- 41129 Dory Ln Unit Lot 1007
- 41182 Fathom Ct Unit Lot: 802
- 41155 Channel Ct Unit Lot 717
- 41454 Ocean View Dr Unit Lot 20
- 41578 Starboard Dr Unit Lot 744
- 40270 Dune Way Unit 12
- 14 Dune Way Unit Lot 14
- 40300 Dune Way Unit 10
- 40281 Moore Way
- 40291 Moore Way
- 40262 Dune Way Unit 13
- 40262 Dune Way
- 42091 Dune Way Unit ID1255932P
- 40291 Dune Way Unit 6
- 40291 Dune Way
- 40275 Dune Way
- 40304 Dune Way
- 40269 Moore Way
- 40299 Moore Way Unit 8
- 40263 Dune Way Unit 4
- 40263 Dune Way
- 40303 Dune Way
- 40244 Dune Way
- 40823 Nc 12 Hwy Unit Lot None
- 40823 Nc 12 Hwy