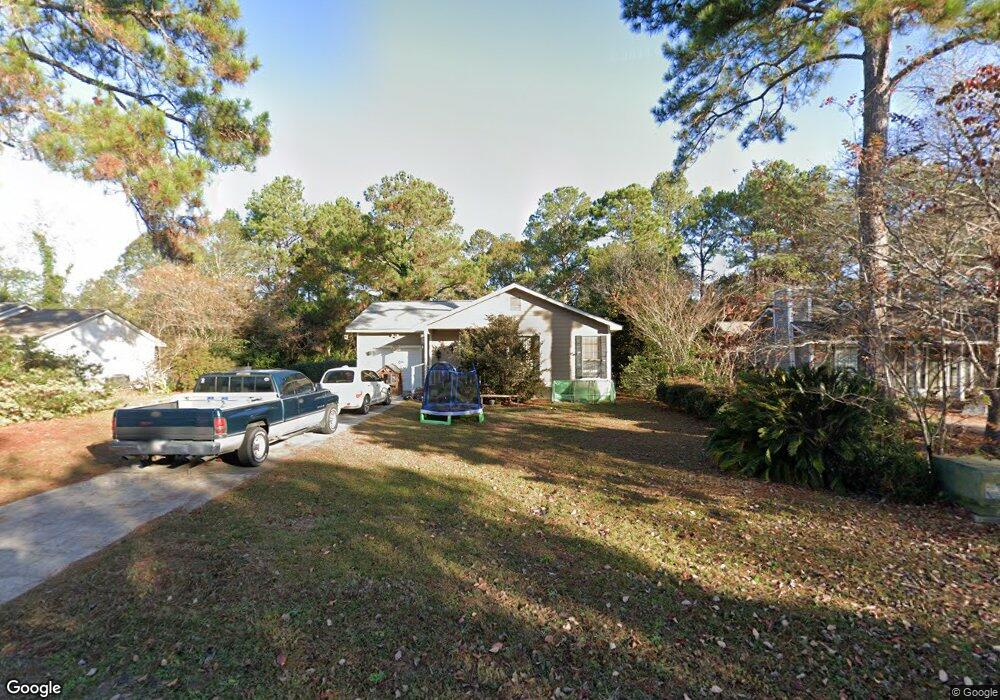
403 26th St E Tifton, GA 31794
Estimated Value: $155,000 - $174,000
2
Beds
2
Baths
1,140
Sq Ft
$148/Sq Ft
Est. Value
About This Home
This home is located at 403 26th St E, Tifton, GA 31794 and is currently estimated at $168,823, approximately $148 per square foot. 403 26th St E is a home located in Tift County with nearby schools including Northside Primary School, Charles Spencer Elementary School, and J.T. Reddick School.
Ownership History
Date
Name
Owned For
Owner Type
Purchase Details
Closed on
Dec 8, 2017
Sold by
Hanington Timothy S
Bought by
Cooper Michael J
Current Estimated Value
Home Financials for this Owner
Home Financials are based on the most recent Mortgage that was taken out on this home.
Original Mortgage
$95,959
Outstanding Balance
$80,705
Interest Rate
3.9%
Mortgage Type
New Conventional
Estimated Equity
$88,118
Purchase Details
Closed on
Jun 2, 2014
Sold by
Gandy Jane
Bought by
Hanington Timothy S and Hanington Sandra L
Purchase Details
Closed on
Mar 7, 1997
Sold by
Drexler Philip Stacy and Karen Angie
Bought by
Gandy Jane
Purchase Details
Closed on
Nov 20, 1996
Sold by
Daigle Kathy M and Edenfield Darrell Cha
Bought by
Drexler Philip Stacy and Karen Angie
Purchase Details
Closed on
Nov 22, 1995
Sold by
Sumner Marjorie M Nka Dillard
Bought by
Ziegler Kathy M and Ziegler Edenfield,Darrell
Purchase Details
Closed on
Aug 26, 1994
Sold by
Rogers Ethel Delores
Bought by
Sumner Marjorie M
Purchase Details
Closed on
Jul 18, 1989
Sold by
Bray Vincent L and Bray Tracy C
Bought by
Rogers Delores
Purchase Details
Closed on
Sep 22, 1987
Sold by
Green Industries Inc
Bought by
Bray Vincent L and Bray Tracey C
Create a Home Valuation Report for This Property
The Home Valuation Report is an in-depth analysis detailing your home's value as well as a comparison with similar homes in the area
Home Values in the Area
Average Home Value in this Area
Purchase History
| Date | Buyer | Sale Price | Title Company |
|---|---|---|---|
| Cooper Michael J | $95,000 | -- | |
| Hanington Timothy S | $77,000 | -- | |
| Gandy Jane | $61,000 | -- | |
| Drexler Philip Stacy | $59,500 | -- | |
| Ziegler Kathy M | $57,500 | -- | |
| Sumner Marjorie M | $55,000 | -- | |
| Rogers Delores | $48,500 | -- | |
| Bray Vincent L | $45,900 | -- |
Source: Public Records
Mortgage History
| Date | Status | Borrower | Loan Amount |
|---|---|---|---|
| Open | Cooper Michael J | $95,959 |
Source: Public Records
Tax History Compared to Growth
Tax History
| Year | Tax Paid | Tax Assessment Tax Assessment Total Assessment is a certain percentage of the fair market value that is determined by local assessors to be the total taxable value of land and additions on the property. | Land | Improvement |
|---|---|---|---|---|
| 2024 | $1,509 | $55,970 | $12,120 | $43,850 |
| 2023 | $1,604 | $33,549 | $4,000 | $29,549 |
| 2022 | $1,263 | $33,549 | $4,000 | $29,549 |
| 2021 | $1,271 | $33,549 | $4,000 | $29,549 |
| 2020 | $1,118 | $28,810 | $4,000 | $24,810 |
| 2019 | $1,119 | $28,810 | $4,000 | $24,810 |
| 2018 | $1,119 | $28,810 | $4,000 | $24,810 |
| 2017 | $1,148 | $28,810 | $4,000 | $24,810 |
| 2016 | $1,150 | $28,810 | $4,000 | $24,810 |
| 2015 | $1,151 | $28,810 | $4,000 | $24,810 |
| 2014 | $808 | $28,810 | $4,000 | $24,810 |
| 2013 | -- | $28,809 | $4,000 | $24,809 |
Source: Public Records
Map
Nearby Homes
- 2411 Davis Ave
- 2417 Belmont Ave
- 2214 Love Ave
- 2020 Davis Ave
- 2021 Davis Ave
- 502 20th St E
- 705 20th St E
- 1809 Davis Ave
- 2612 Goff St
- 714 44th St E
- 903 42nd St E
- 0 44th St E
- 1611 Love Ave
- 717 E 44th St
- 0 Tift Ave
- 0 E 46th St
- 913 E 46th St
- 0 Central Ave Unit 138182
- 0 Central Ave Unit 137897
- 0 Central Ave Unit 137896
- 405 26th St E
- 401 26th St E
- E E 26th St
- 407 26th St E
- 322 Allisons Way
- 305 26th St E
- 402 26th St E
- 2418 Prince Ave
- 501 26th St E
- 320 Allisons Way
- 307 26th St E
- 2620 Diana Cir
- 318 Allisons Way
- 306 26th St E
- 316 Allisons Way
- 521 26th St E
- 321 Allisons Way
- 2416 Prince Ave
- 319 Allison's Way
- 2618 Diana Cir