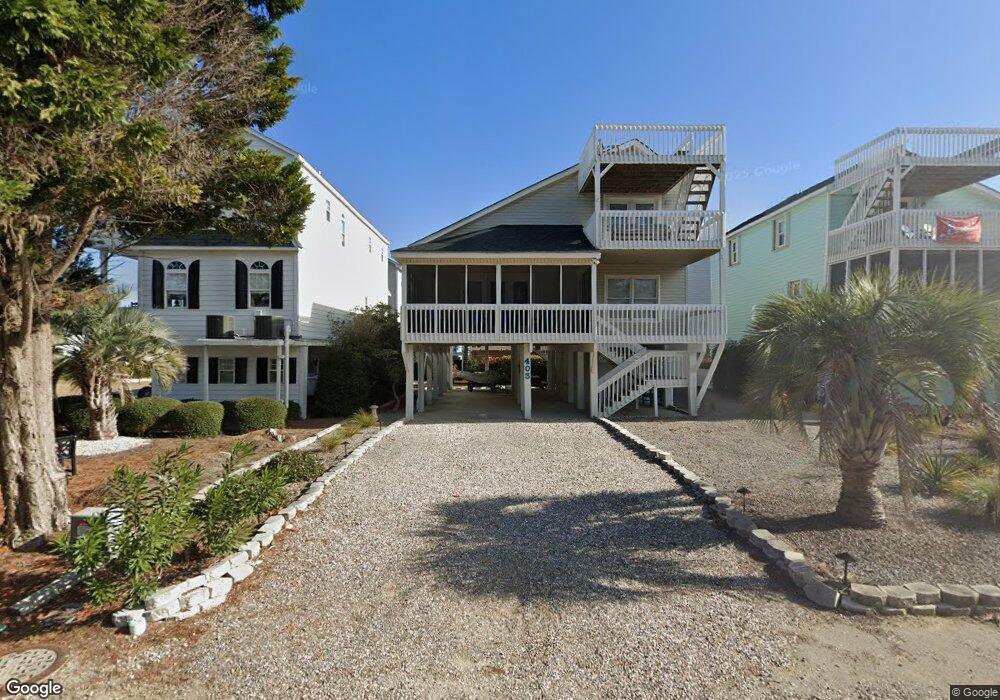
403 2nd St Sunset Beach, NC 28468
Estimated Value: $533,000 - $865,000
3
Beds
2
Baths
1,540
Sq Ft
$461/Sq Ft
Est. Value
About This Home
This home is located at 403 2nd St, Sunset Beach, NC 28468 and is currently estimated at $710,281, approximately $461 per square foot. 403 2nd St is a home located in Brunswick County with nearby schools including Jessie Mae Monroe Elementary School, Shallotte Middle School, and West Brunswick High School.
Ownership History
Date
Name
Owned For
Owner Type
Purchase Details
Closed on
Jul 9, 2021
Sold by
Gonzalez Ricardo and Gonzalez Patricia
Bought by
Gonzalez Luis Miguel and Gonzalez Jessica Hoying
Current Estimated Value
Home Financials for this Owner
Home Financials are based on the most recent Mortgage that was taken out on this home.
Original Mortgage
$308,800
Outstanding Balance
$280,188
Interest Rate
2.9%
Mortgage Type
New Conventional
Estimated Equity
$430,093
Purchase Details
Closed on
Feb 19, 2008
Sold by
Vernon Donald R and Vernon Terry W
Bought by
Gonzalez Ricardo and Gonzalez Patricia
Home Financials for this Owner
Home Financials are based on the most recent Mortgage that was taken out on this home.
Original Mortgage
$235,000
Interest Rate
5.47%
Mortgage Type
Purchase Money Mortgage
Create a Home Valuation Report for This Property
The Home Valuation Report is an in-depth analysis detailing your home's value as well as a comparison with similar homes in the area
Home Values in the Area
Average Home Value in this Area
Purchase History
| Date | Buyer | Sale Price | Title Company |
|---|---|---|---|
| Gonzalez Luis Miguel | $386,000 | None Available | |
| Gonzalez Ricardo | $550,000 | None Available |
Source: Public Records
Mortgage History
| Date | Status | Borrower | Loan Amount |
|---|---|---|---|
| Open | Gonzalez Luis Miguel | $308,800 | |
| Previous Owner | Gonzalez Ricardo | $235,000 |
Source: Public Records
Tax History
| Year | Tax Paid | Tax Assessment Tax Assessment Total Assessment is a certain percentage of the fair market value that is determined by local assessors to be the total taxable value of land and additions on the property. | Land | Improvement |
|---|---|---|---|---|
| 2025 | $3,435 | $644,430 | $240,000 | $404,430 |
| 2024 | $34 | $644,430 | $240,000 | $404,430 |
| 2023 | $2,588 | $644,430 | $240,000 | $404,430 |
| 2022 | $2,588 | $371,810 | $135,000 | $236,810 |
| 2021 | $1,989 | $371,810 | $135,000 | $236,810 |
| 2020 | $2,588 | $371,810 | $135,000 | $236,810 |
| 2019 | $2,588 | $135,000 | $135,000 | $0 |
| 2018 | $2,404 | $350,060 | $130,000 | $220,060 |
| 2017 | $2,383 | $130,000 | $130,000 | $0 |
| 2016 | $2,358 | $130,000 | $130,000 | $0 |
| 2015 | $2,358 | $350,060 | $130,000 | $220,060 |
| 2014 | $2,624 | $461,050 | $330,000 | $131,050 |
Source: Public Records
Map
Nearby Homes
- 410 2nd St
- 405 5th St
- 430 3rd St
- 405 27th St Unit B
- 411 27th St Unit B
- 427 6th St
- 413 27th St Unit B
- 1534 Riverside Dr
- 1532 Riverside Dr
- 419 Sailfish St
- 204 W Main St
- 402 Dolphin St
- 203 W Main St
- 425 Dolphin St
- Lot 62 Riverside Dr
- 411 34th St
- 607 W Main St Unit A & B
- 1212 E Main St
- 802 W Main St
- 406 36th St
Your Personal Tour Guide
Ask me questions while you tour the home.