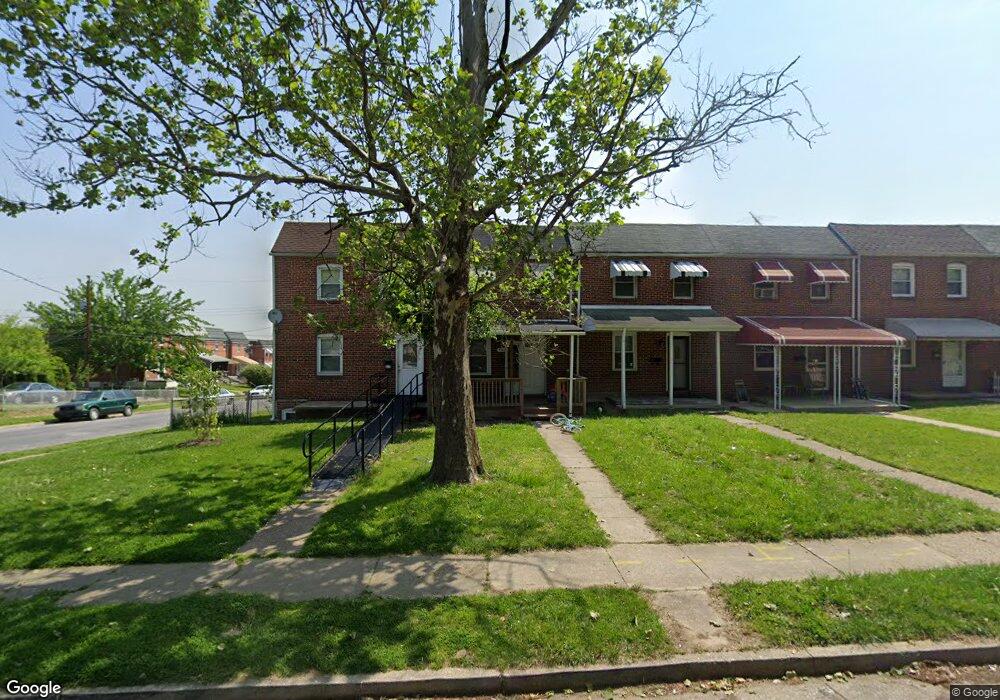
403 52nd St Baltimore, MD 21224
Estimated Value: $179,000 - $186,000
4
Beds
3
Baths
1,008
Sq Ft
$181/Sq Ft
Est. Value
About This Home
This home is located at 403 52nd St, Baltimore, MD 21224 and is currently estimated at $182,500, approximately $181 per square foot. 403 52nd St is a home located in Baltimore County with nearby schools including Colgate Elementary, Holabird Middle School, and Dundalk High School.
Ownership History
Date
Name
Owned For
Owner Type
Purchase Details
Closed on
Jun 27, 2019
Sold by
Sofola Kolawole R
Bought by
2Nd Baltimore Acquisition Llc
Current Estimated Value
Purchase Details
Closed on
Jun 21, 2012
Sold by
Bolewicki Agatha M and Bolewicki Irene A
Bought by
Bolewicki Agatha M and Bolewicki Irene A
Purchase Details
Closed on
Nov 16, 2004
Sold by
Secretary Of Housing
Bought by
Sofola Kolawole R
Purchase Details
Closed on
Mar 22, 2004
Sold by
Rabi Karin Ann
Bought by
Secretary Of Housing and Urban Development
Purchase Details
Closed on
Aug 9, 2000
Sold by
North Pole Investors Inc
Bought by
Rabi Karin Ann
Purchase Details
Closed on
Oct 22, 1997
Sold by
Secretary Of The United States
Bought by
North Pole Investors Inc
Purchase Details
Closed on
Jun 23, 1997
Sold by
Carpenter Stephen W
Bought by
Secretary Of The United States and Dept Of Housing & Urban Dev
Create a Home Valuation Report for This Property
The Home Valuation Report is an in-depth analysis detailing your home's value as well as a comparison with similar homes in the area
Home Values in the Area
Average Home Value in this Area
Purchase History
| Date | Buyer | Sale Price | Title Company |
|---|---|---|---|
| 2Nd Baltimore Acquisition Llc | $70,500 | Greenwood Title Inc | |
| Bolewicki Agatha M | -- | None Available | |
| Sofola Kolawole R | $65,000 | -- | |
| Secretary Of Housing | $78,000 | -- | |
| Secretary Of Housing | $78,000 | -- | |
| Rabi Karin Ann | $68,000 | -- | |
| North Pole Investors Inc | $40,700 | -- | |
| Secretary Of The United States | $62,236 | -- |
Source: Public Records
Tax History
| Year | Tax Paid | Tax Assessment Tax Assessment Total Assessment is a certain percentage of the fair market value that is determined by local assessors to be the total taxable value of land and additions on the property. | Land | Improvement |
|---|---|---|---|---|
| 2025 | $2,522 | $117,167 | -- | -- |
| 2024 | $2,522 | $110,133 | -- | -- |
| 2023 | $2,179 | $103,100 | $40,000 | $63,100 |
| 2022 | $2,251 | $98,600 | $0 | $0 |
| 2021 | $1,079 | $94,100 | $0 | $0 |
| 2020 | $1,583 | $89,600 | $40,000 | $49,600 |
| 2019 | $1,081 | $89,167 | $0 | $0 |
| 2018 | $1,550 | $88,733 | $0 | $0 |
| 2017 | $1,356 | $88,300 | $0 | $0 |
| 2016 | $2,266 | $88,300 | $0 | $0 |
| 2015 | $2,266 | $88,300 | $0 | $0 |
| 2014 | $2,266 | $93,700 | $0 | $0 |
Source: Public Records
Map
Nearby Homes
- 7820 Wynbrook Rd
- 7746 Eastdale Rd
- 7956 Eastdale Rd
- 8012 Wynbrook Rd
- 8031 Bank St
- 619 N Point Rd
- 8049 Lansdale Rd
- 7316 Conley St
- 7307 Conley St
- 7279 Gough St
- 7627 Carson Ave
- 7515 Belmont Ave
- 7506 Belmont Ave
- 7200 Conley St
- 7107 E Baltimore St
- 7412 Belmont Ave
- 7165 Gough St
- 7428 Poplar Ave
- 7406 Poplar Ave
- 7404 Poplar Ave
Your Personal Tour Guide
Ask me questions while you tour the home.