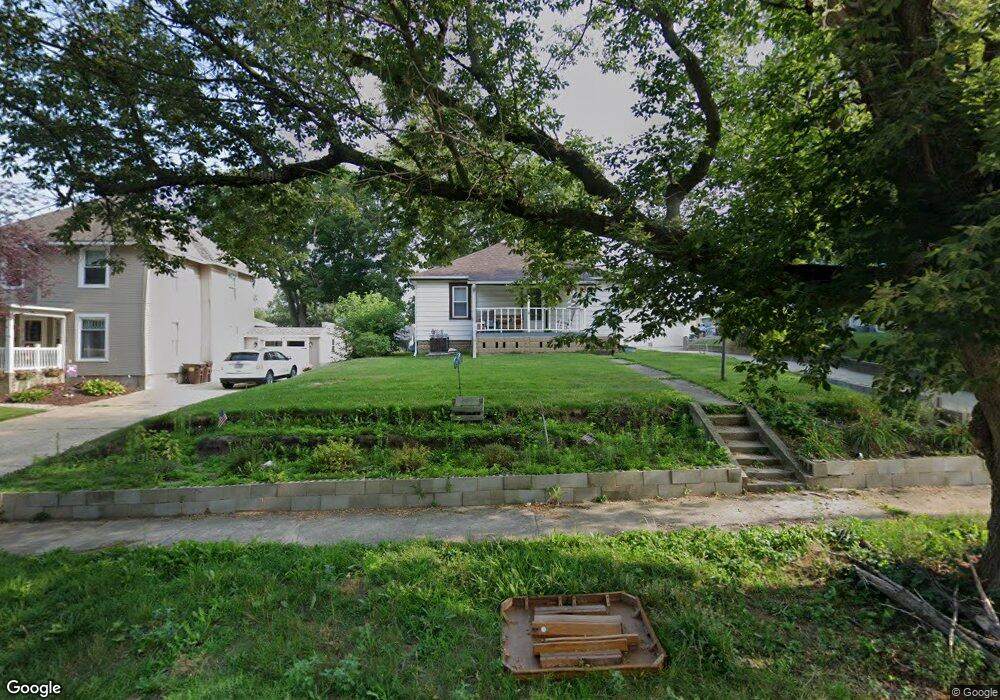
403 Ada St Rock Falls, IL 61071
Estimated Value: $22,372 - $89,000
3
Beds
--
Bath
772
Sq Ft
$90/Sq Ft
Est. Value
About This Home
This home is located at 403 Ada St, Rock Falls, IL 61071 and is currently estimated at $69,343, approximately $89 per square foot. 403 Ada St is a home located in Whiteside County with nearby schools including Merrill Elementary School, Dillon Elementary School, and Rock Falls Middle School.
Ownership History
Date
Name
Owned For
Owner Type
Purchase Details
Closed on
Nov 7, 2024
Sold by
Giacobbe Jeffrey J
Bought by
M5 Industries Llc
Current Estimated Value
Purchase Details
Closed on
Feb 27, 2017
Sold by
Brotheridge Douglas H and Hasbrouck Debra L
Bought by
Giacobbe Jeffrey J
Home Financials for this Owner
Home Financials are based on the most recent Mortgage that was taken out on this home.
Original Mortgage
$46,464
Interest Rate
4.25%
Mortgage Type
New Conventional
Purchase Details
Closed on
Feb 23, 2017
Sold by
Brotheridge Dave E
Bought by
Giacobbe Jeffrey J
Home Financials for this Owner
Home Financials are based on the most recent Mortgage that was taken out on this home.
Original Mortgage
$46,464
Interest Rate
4.25%
Mortgage Type
New Conventional
Create a Home Valuation Report for This Property
The Home Valuation Report is an in-depth analysis detailing your home's value as well as a comparison with similar homes in the area
Home Values in the Area
Average Home Value in this Area
Purchase History
| Date | Buyer | Sale Price | Title Company |
|---|---|---|---|
| M5 Industries Llc | $65,000 | None Listed On Document | |
| M5 Industries Llc | $65,000 | None Listed On Document | |
| Giacobbe Jeffrey J | $30,000 | None Available | |
| Giacobbe Jeffrey J | $15,000 | None Available |
Source: Public Records
Mortgage History
| Date | Status | Borrower | Loan Amount |
|---|---|---|---|
| Previous Owner | Giacobbe Jeffrey J | $46,464 |
Source: Public Records
Tax History Compared to Growth
Tax History
| Year | Tax Paid | Tax Assessment Tax Assessment Total Assessment is a certain percentage of the fair market value that is determined by local assessors to be the total taxable value of land and additions on the property. | Land | Improvement |
|---|---|---|---|---|
| 2024 | $2,253 | $26,541 | $5,642 | $20,899 |
| 2023 | $2,073 | $24,477 | $5,203 | $19,274 |
| 2022 | $1,975 | $23,079 | $4,906 | $18,173 |
| 2021 | $1,861 | $21,834 | $4,641 | $17,193 |
| 2020 | $1,851 | $21,461 | $4,562 | $16,899 |
| 2019 | $1,728 | $20,693 | $4,399 | $16,294 |
| 2018 | $1,489 | $20,232 | $4,301 | $15,931 |
| 2017 | $2,162 | $18,871 | $4,220 | $14,651 |
| 2016 | $864 | $18,554 | $4,149 | $14,405 |
| 2015 | $65 | $19,488 | $4,357 | $15,131 |
| 2014 | $65 | $18,968 | $4,241 | $14,727 |
| 2013 | $65 | $19,488 | $4,357 | $15,131 |
Source: Public Records
Map
Nearby Homes