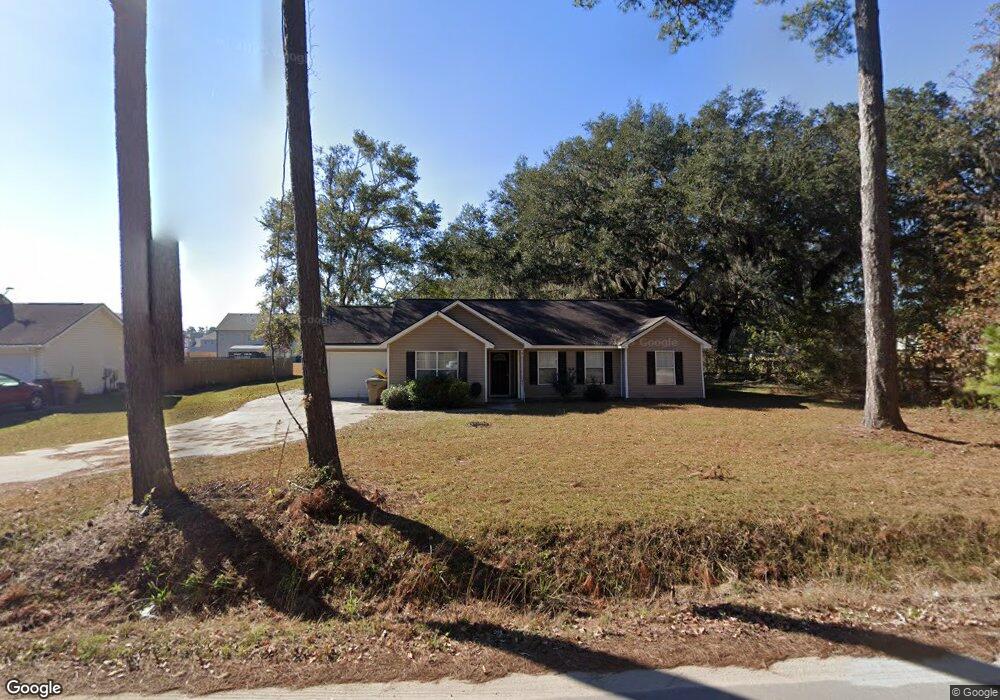
403 Archer Rd Guyton, GA 31312
Estimated Value: $252,000 - $268,000
3
Beds
2
Baths
1,249
Sq Ft
$208/Sq Ft
Est. Value
About This Home
This home is located at 403 Archer Rd, Guyton, GA 31312 and is currently estimated at $259,483, approximately $207 per square foot. 403 Archer Rd is a home located in Effingham County with nearby schools including Guyton Elementary School, Effingham County Middle School, and Effingham County High School.
Ownership History
Date
Name
Owned For
Owner Type
Purchase Details
Closed on
Jun 15, 2016
Sold by
Sec Of Housing & U
Bought by
Hester Likeisha R
Current Estimated Value
Home Financials for this Owner
Home Financials are based on the most recent Mortgage that was taken out on this home.
Original Mortgage
$91,513
Outstanding Balance
$72,462
Interest Rate
3.58%
Mortgage Type
FHA
Estimated Equity
$187,021
Purchase Details
Closed on
Dec 3, 2015
Sold by
Bank Of America N A
Bought by
Secretary Of Housing & Urban Development
Purchase Details
Closed on
Dec 3, 2013
Sold by
Winfree Joshua L
Bought by
Bank Of America
Purchase Details
Closed on
Feb 23, 2006
Sold by
Kessler Ginger L
Bought by
Winfree Joshua L
Home Financials for this Owner
Home Financials are based on the most recent Mortgage that was taken out on this home.
Original Mortgage
$127,381
Interest Rate
6.05%
Mortgage Type
FHA
Create a Home Valuation Report for This Property
The Home Valuation Report is an in-depth analysis detailing your home's value as well as a comparison with similar homes in the area
Home Values in the Area
Average Home Value in this Area
Purchase History
| Date | Buyer | Sale Price | Title Company |
|---|---|---|---|
| Hester Likeisha R | $88,500 | -- | |
| Secretary Of Housing & Urban Development | -- | -- | |
| Bank Of America | $74,100 | -- | |
| Winfree Joshua L | $129,381 | -- |
Source: Public Records
Mortgage History
| Date | Status | Borrower | Loan Amount |
|---|---|---|---|
| Open | Hester Likeisha R | $91,513 | |
| Previous Owner | Winfree Joshua L | $127,381 |
Source: Public Records
Tax History
| Year | Tax Paid | Tax Assessment Tax Assessment Total Assessment is a certain percentage of the fair market value that is determined by local assessors to be the total taxable value of land and additions on the property. | Land | Improvement |
|---|---|---|---|---|
| 2025 | $2,110 | $93,136 | $22,800 | $70,336 |
| 2024 | $2,110 | $86,767 | $22,800 | $63,967 |
| 2023 | $1,299 | $69,516 | $17,600 | $51,916 |
| 2022 | $1,779 | $66,716 | $14,800 | $51,916 |
| 2021 | $1,728 | $58,668 | $14,000 | $44,668 |
| 2020 | $1,707 | $53,028 | $12,000 | $41,028 |
| 2019 | $1,714 | $51,028 | $10,000 | $41,028 |
| 2018 | $1,647 | $48,203 | $10,000 | $38,203 |
| 2017 | $1,271 | $48,203 | $10,000 | $38,203 |
| 2016 | $1,665 | $48,030 | $10,000 | $38,030 |
| 2015 | -- | $40,589 | $6,800 | $33,789 |
| 2014 | -- | $40,589 | $6,800 | $33,789 |
| 2013 | -- | $36,486 | $2,349 | $34,137 |
Source: Public Records
Map
Nearby Homes
- 4 Cottonfield Dr
- 2 Sweet Berry
- 12 Cottonfield Dr
- 4 Saint Anne Ct
- 500 Archer Rd
- 1 Saint Anne Ct
- 23 Oakmont Dr
- 8 Oak Aly
- 20 Cottonfield Dr
- 81 Oakmont Dr
- 2 Oak Aly
- 9 Bellemeade Dr
- 108 Concord Dr
- 72 Oakmont Dr
- 21 Belvedere Dr
- 1 Bellemeade Dr
- 82 Oakmont Dr
- 10 High Meadow Crossing
- 101 Oakmont Dr
- 31 Beauregard Blvd
Your Personal Tour Guide
Ask me questions while you tour the home.