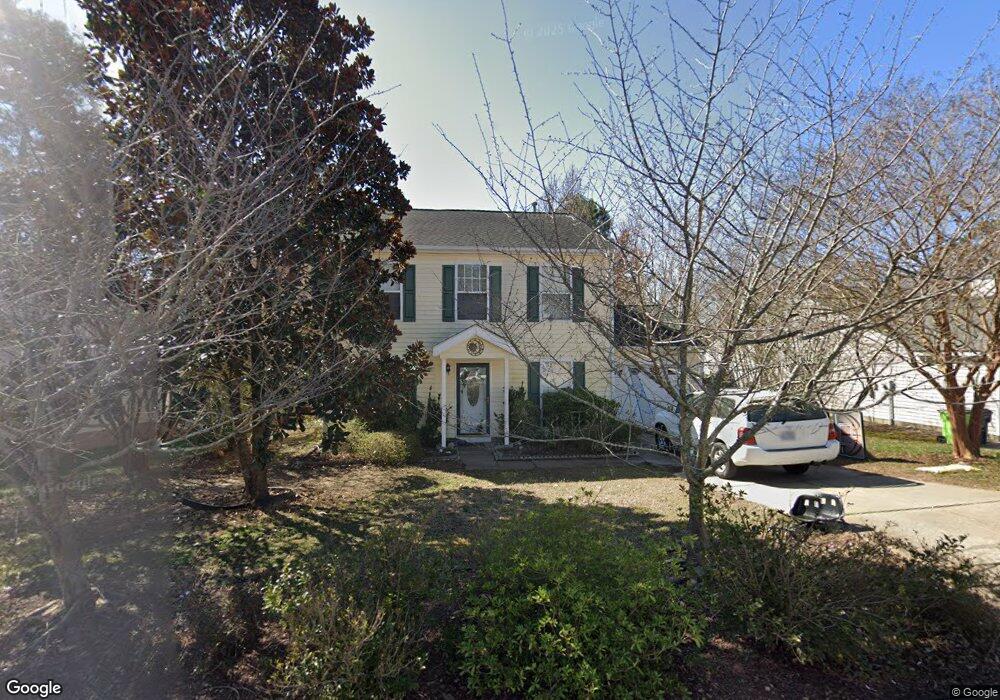
403 Blushing Rose Way Apex, NC 27502
West Apex NeighborhoodEstimated Value: $416,000 - $437,000
3
Beds
3
Baths
1,509
Sq Ft
$280/Sq Ft
Est. Value
About This Home
This home is located at 403 Blushing Rose Way, Apex, NC 27502 and is currently estimated at $422,959, approximately $280 per square foot. 403 Blushing Rose Way is a home located in Wake County with nearby schools including Olive Chapel Elementary School, Lufkin Road Middle School, and Apex Friendship High School.
Ownership History
Date
Name
Owned For
Owner Type
Purchase Details
Closed on
Apr 24, 2019
Sold by
Carswell Teresa and Carswell Dennis
Bought by
Mccully Jessica Lynn
Current Estimated Value
Home Financials for this Owner
Home Financials are based on the most recent Mortgage that was taken out on this home.
Original Mortgage
$229,500
Outstanding Balance
$201,771
Interest Rate
4.3%
Mortgage Type
New Conventional
Estimated Equity
$221,188
Purchase Details
Closed on
Apr 29, 2005
Sold by
Ferrell Jerry T and Ferrell Misty M
Bought by
Carswell Dennis and Carswell Teresa
Home Financials for this Owner
Home Financials are based on the most recent Mortgage that was taken out on this home.
Original Mortgage
$114,600
Interest Rate
5.88%
Mortgage Type
Fannie Mae Freddie Mac
Purchase Details
Closed on
Nov 25, 1997
Sold by
Bent Tree Ltd Liability Company
Bought by
Starmount Realty Inc
Create a Home Valuation Report for This Property
The Home Valuation Report is an in-depth analysis detailing your home's value as well as a comparison with similar homes in the area
Home Values in the Area
Average Home Value in this Area
Purchase History
| Date | Buyer | Sale Price | Title Company |
|---|---|---|---|
| Mccully Jessica Lynn | $255,000 | None Available | |
| Carswell Dennis | $143,500 | -- | |
| Starmount Realty Inc | $82,000 | -- |
Source: Public Records
Mortgage History
| Date | Status | Borrower | Loan Amount |
|---|---|---|---|
| Open | Mccully Jessica Lynn | $229,500 | |
| Previous Owner | Carswell Dennis | $114,600 | |
| Closed | Carswell Dennis | $28,650 |
Source: Public Records
Tax History
| Year | Tax Paid | Tax Assessment Tax Assessment Total Assessment is a certain percentage of the fair market value that is determined by local assessors to be the total taxable value of land and additions on the property. | Land | Improvement |
|---|---|---|---|---|
| 2025 | $3,579 | $407,602 | $180,000 | $227,602 |
| 2024 | $3,499 | $407,602 | $180,000 | $227,602 |
Source: Public Records
Map
Nearby Homes
- 301 Kinship Ln
- 1512 Piazzo Ct
- 2552 Olive Chapel Rd
- 2550 Olive Chapel Rd
- 2560 Olive Chapel Rd
- 2522 Olive Chapel Rd
- 2562 Olive Chapel Rd
- 1508 Braden Overlook Ct
- 2530 Olive Chapel Rd
- 2831 Water Tower Ln
- 1404 Chrysalis Place
- 1559 Kythira Dr
- 2863 Farmhouse Dr
- 2867 Farmhouse Dr
- 1608 Kythira Dr
- 2805 Farmhouse Dr
- 2854 Farmhouse Dr
- 2856 Farmhouse Dr
- 1860 Hammocks Beach Trail
- 1451 Rowboat Rd
- 405 Blushing Rose Way
- 401 Blushing Rose Way
- 203 Tobacco Farm Dr
- 407 Blushing Rose Way
- 404 Blushing Rose Way
- 400 Blushing Rose Way
- 406 Blushing Rose Way
- 205 Tobacco Farm Dr
- 408 Blushing Rose Way
- 409 Blushing Rose Way
- 103 Tobacco Farm Dr
- 202 Tobacco Farm Dr
- 410 Blushing Rose Way
- 200 Tobacco Farm Dr
- 206 Tobacco Farm Dr
- 106 Tobacco Farm Dr
- 614 Kinship Ln
- 616 Kinship Ln
- 411 Blushing Rose Way
- 612 Kinship Ln
Your Personal Tour Guide
Ask me questions while you tour the home.