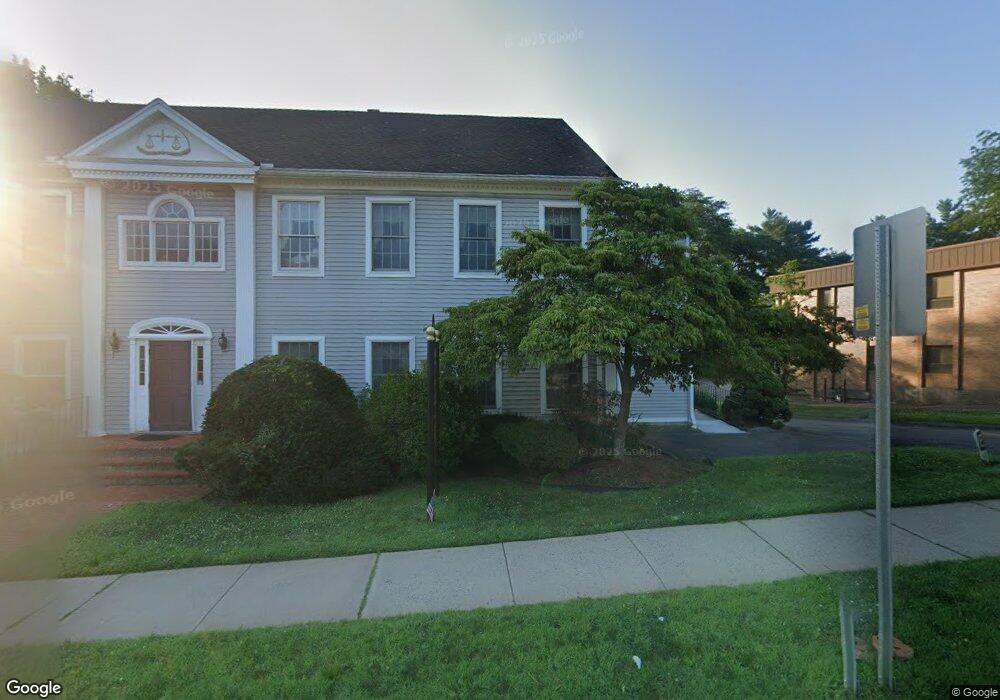
403 Broad St Meriden, CT 06450
Estimated Value: $145,000 - $175,000
1
Bed
1
Bath
968
Sq Ft
$164/Sq Ft
Est. Value
About This Home
This home is located at 403 Broad St, Meriden, CT 06450 and is currently estimated at $158,524, approximately $163 per square foot. 403 Broad St is a home located in New Haven County with nearby schools including Israel Putnam School, Washington Middle School, and Francis T. Maloney High School.
Ownership History
Date
Name
Owned For
Owner Type
Purchase Details
Closed on
Jan 22, 2013
Sold by
Fnma
Bought by
Dodd Charlotte
Current Estimated Value
Home Financials for this Owner
Home Financials are based on the most recent Mortgage that was taken out on this home.
Original Mortgage
$30,000
Outstanding Balance
$20,805
Interest Rate
3.39%
Mortgage Type
New Conventional
Estimated Equity
$137,719
Purchase Details
Closed on
Oct 10, 2012
Sold by
Phh Mortgage Corp
Bought by
Federal National Mortgage Association
Purchase Details
Closed on
Aug 24, 2012
Sold by
Cordon Susan A
Bought by
Phh Mortgage Corp
Purchase Details
Closed on
Jul 7, 2003
Sold by
Schultz Richard P
Bought by
Cordon Susan A
Home Financials for this Owner
Home Financials are based on the most recent Mortgage that was taken out on this home.
Original Mortgage
$64,000
Interest Rate
5.46%
Create a Home Valuation Report for This Property
The Home Valuation Report is an in-depth analysis detailing your home's value as well as a comparison with similar homes in the area
Home Values in the Area
Average Home Value in this Area
Purchase History
| Date | Buyer | Sale Price | Title Company |
|---|---|---|---|
| Dodd Charlotte | $37,500 | -- | |
| Federal National Mortgage Association | -- | -- | |
| Phh Mortgage Corp | -- | -- | |
| Cordon Susan A | $71,000 | -- |
Source: Public Records
Mortgage History
| Date | Status | Borrower | Loan Amount |
|---|---|---|---|
| Open | Cordon Susan A | $30,000 | |
| Previous Owner | Cordon Susan A | $64,000 |
Source: Public Records
Tax History
| Year | Tax Paid | Tax Assessment Tax Assessment Total Assessment is a certain percentage of the fair market value that is determined by local assessors to be the total taxable value of land and additions on the property. | Land | Improvement |
|---|---|---|---|---|
| 2025 | $2,049 | $51,100 | $0 | $51,100 |
| 2024 | $1,855 | $51,100 | $0 | $51,100 |
| 2023 | $1,778 | $51,100 | $0 | $51,100 |
| 2022 | $1,686 | $51,100 | $0 | $51,100 |
| 2021 | $1,381 | $33,810 | $0 | $33,810 |
| 2020 | $1,381 | $33,810 | $0 | $33,810 |
| 2019 | $1,381 | $33,810 | $0 | $33,810 |
| 2018 | $1,388 | $33,810 | $0 | $33,810 |
| 2017 | $1,350 | $33,810 | $0 | $33,810 |
| 2016 | $2,051 | $56,000 | $0 | $56,000 |
| 2015 | $2,051 | $56,000 | $0 | $56,000 |
| 2014 | $2,001 | $56,000 | $0 | $56,000 |
Source: Public Records
Map
Nearby Homes
Your Personal Tour Guide
Ask me questions while you tour the home.