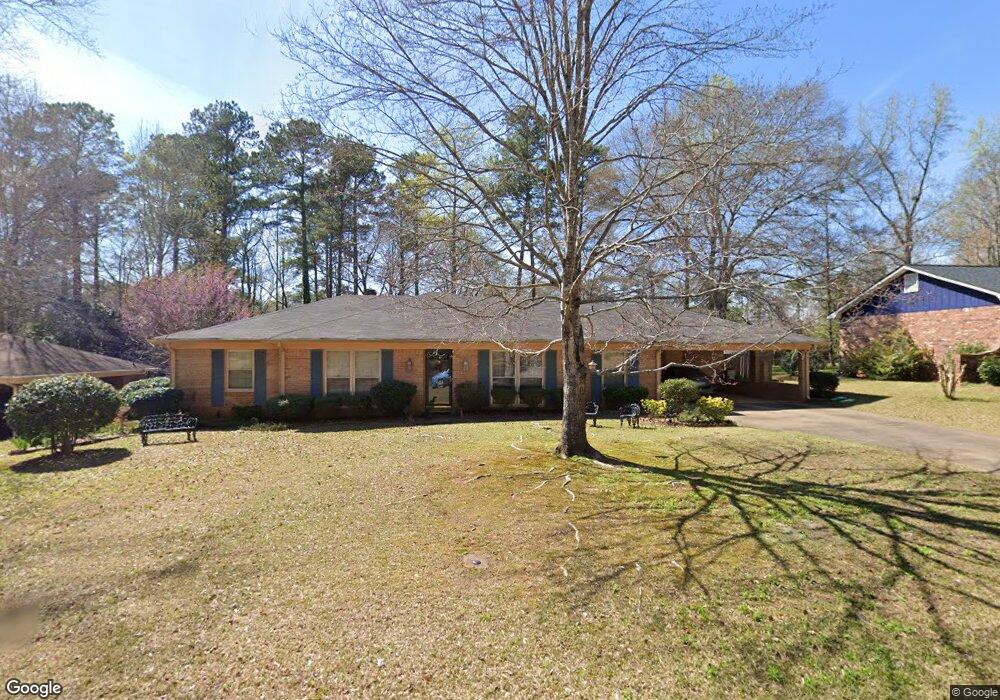
403 Camelot Dr Lagrange, GA 30241
Estimated Value: $216,971 - $266,000
4
Beds
2
Baths
1,712
Sq Ft
$141/Sq Ft
Est. Value
About This Home
This home is located at 403 Camelot Dr, Lagrange, GA 30241 and is currently estimated at $240,743, approximately $140 per square foot. 403 Camelot Dr is a home located in Troup County with nearby schools including Franklin Forest Elementary School, Hollis Hand Elementary School, and Ethel W. Kight Elementary School.
Ownership History
Date
Name
Owned For
Owner Type
Purchase Details
Closed on
Mar 30, 1993
Sold by
Stich J
Bought by
Delaney Mary Jean
Current Estimated Value
Purchase Details
Closed on
Jul 1, 1988
Sold by
Debra Wm W and Debra Tarpley
Bought by
Stich J
Purchase Details
Closed on
Sep 27, 1985
Sold by
Sheila Alfred and Sheila Mcnamara
Bought by
Debra Wm W and Debra Tarpley
Purchase Details
Closed on
May 2, 1983
Sold by
West Ga Estates Inc
Bought by
Sheila Alfred and Sheila Mcnamara
Purchase Details
Closed on
Mar 7, 1983
Sold by
Lynn Raymond and Lynn Garrard
Bought by
West Ga Estates Inc
Purchase Details
Closed on
Mar 10, 1979
Sold by
Warren Jessie and Warren Mccollough
Bought by
Lynn Raymond and Lynn Garrard
Purchase Details
Closed on
Dec 28, 1976
Sold by
Lagrange Investment Co
Bought by
Warren Jessie and Warren Mccollough
Create a Home Valuation Report for This Property
The Home Valuation Report is an in-depth analysis detailing your home's value as well as a comparison with similar homes in the area
Purchase History
| Date | Buyer | Sale Price | Title Company |
|---|---|---|---|
| Delaney Mary Jean | $80,500 | -- | |
| Stich J | $81,600 | -- | |
| Debra Wm W | -- | -- | |
| Sheila Alfred | -- | -- | |
| West Ga Estates Inc | -- | -- | |
| Lynn Raymond | -- | -- | |
| Warren Jessie | -- | -- |
Source: Public Records
Tax History
| Year | Tax Paid | Tax Assessment Tax Assessment Total Assessment is a certain percentage of the fair market value that is determined by local assessors to be the total taxable value of land and additions on the property. | Land | Improvement |
|---|---|---|---|---|
| 2025 | $1,268 | $78,560 | $10,000 | $68,560 |
| 2024 | $1,117 | $70,000 | $10,000 | $60,000 |
| 2023 | $941 | $63,560 | $10,000 | $53,560 |
| 2022 | $903 | $60,960 | $10,000 | $50,960 |
| 2021 | $513 | $45,720 | $8,000 | $37,720 |
| 2020 | $1,078 | $45,720 | $8,000 | $37,720 |
| 2019 | $1,134 | $47,560 | $8,000 | $39,560 |
| 2018 | $899 | $39,760 | $6,000 | $33,760 |
| 2017 | $899 | $39,760 | $6,000 | $33,760 |
| 2016 | $877 | $39,024 | $6,000 | $33,024 |
| 2015 | $805 | $36,619 | $6,360 | $30,259 |
| 2014 | $757 | $35,026 | $6,360 | $28,666 |
| 2013 | -- | $37,063 | $6,360 | $30,703 |
Source: Public Records
Map
Nearby Homes
- 203 Bonaventure Dr
- 224 Rutland Cir
- 210 Hearthstone Dr
- 102 Dogwood Dr
- 202 Park Hill Dr
- 706 N Harlem Cir
- 87 Youngs Mill Rd
- 616 S Harlem Cir
- 131 Foch St
- 114 Briarcliff Rd
- 806 New Franklin Rd
- 115 Clara Jean Ct
- 110 Lenox Cir
- 212 Cleveland Dr
- 204 Cleveland Dr
- 900 North St
- 110 Russell St
- 204 Colonial St
- 107 N Barnard Ave
- 0 N Barnard Ave
- 401 Camelot Dr
- 401 Camelot Dr Unit 50
- 405 Camelot Dr
- 306 Valley Ct
- 402 Camelot Dr
- 404 Camelot Dr
- 407 Camelot Dr
- 308 Valley Ct
- 470 Hickory Terrace
- 304 Valley Ct
- 468 Hickory Terrace
- 406 Camelot Dr
- 400 Camelot Dr
- 409 Camelot Dr
- 310 Valley Ct
- 310 Valley Ct Unit 45
- 500 Hickory Terrace
- 466 Hickory Terrace Unit 32
- 466 Hickory Terrace
- 302 Valley Ct
Your Personal Tour Guide
Ask me questions while you tour the home.