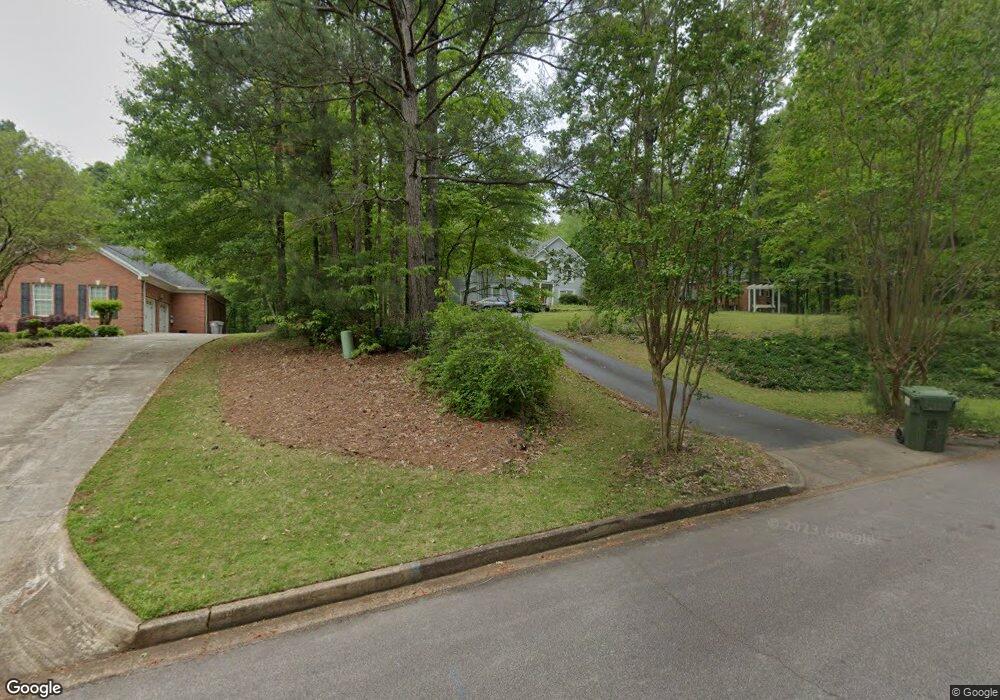
403 Canterbury Dr Lagrange, GA 30241
Estimated Value: $419,925 - $512,000
4
Beds
4
Baths
3,545
Sq Ft
$134/Sq Ft
Est. Value
About This Home
This home is located at 403 Canterbury Dr, Lagrange, GA 30241 and is currently estimated at $474,981, approximately $133 per square foot. 403 Canterbury Dr is a home located in Troup County with nearby schools including Franklin Forest Elementary School, Hillcrest Elementary School, and Hollis Hand Elementary School.
Ownership History
Date
Name
Owned For
Owner Type
Purchase Details
Closed on
Dec 15, 2020
Sold by
Winget Jeffrey
Bought by
Winget Jeffrey and Winget Judith
Current Estimated Value
Home Financials for this Owner
Home Financials are based on the most recent Mortgage that was taken out on this home.
Original Mortgage
$277,610
Outstanding Balance
$252,227
Interest Rate
2.7%
Mortgage Type
New Conventional
Estimated Equity
$198,919
Purchase Details
Closed on
Dec 4, 2002
Sold by
Interest
Bought by
Petrus Eric J and Petrus Tomma
Purchase Details
Closed on
Jun 5, 2001
Sold by
Patrice Salter
Bought by
Interest
Purchase Details
Closed on
Sep 2, 1994
Sold by
Hubert S Salter
Bought by
Patrice Salter
Purchase Details
Closed on
Jul 31, 1990
Sold by
Cloisters Dev Co
Bought by
Hubert S Salter
Purchase Details
Closed on
Jul 30, 1990
Sold by
C&S National Bank
Bought by
Cloisters Dev Co
Purchase Details
Closed on
Jun 16, 1989
Sold by
Larry Garner
Bought by
C&S National Bank
Create a Home Valuation Report for This Property
The Home Valuation Report is an in-depth analysis detailing your home's value as well as a comparison with similar homes in the area
Home Values in the Area
Average Home Value in this Area
Purchase History
| Date | Buyer | Sale Price | Title Company |
|---|---|---|---|
| Winget Jeffrey | -- | -- | |
| Winget Jeffrey | $326,600 | -- | |
| Petrus Eric J | -- | -- | |
| Interest | $212,000 | -- | |
| Patrice Salter | -- | -- | |
| Hubert S Salter | $24,100 | -- | |
| Cloisters Dev Co | -- | -- | |
| C&S National Bank | -- | -- |
Source: Public Records
Mortgage History
| Date | Status | Borrower | Loan Amount |
|---|---|---|---|
| Open | Winget Jeffrey | $277,610 | |
| Closed | Winget Jeffrey | $277,610 | |
| Previous Owner | Petrus Eric J | $87,100 |
Source: Public Records
Tax History Compared to Growth
Tax History
| Year | Tax Paid | Tax Assessment Tax Assessment Total Assessment is a certain percentage of the fair market value that is determined by local assessors to be the total taxable value of land and additions on the property. | Land | Improvement |
|---|---|---|---|---|
| 2024 | $3,924 | $143,896 | $18,000 | $125,896 |
| 2023 | $3,828 | $140,372 | $14,000 | $126,372 |
| 2022 | $3,696 | $132,412 | $14,000 | $118,412 |
| 2021 | $3,883 | $128,760 | $14,000 | $114,760 |
| 2020 | $2,996 | $101,320 | $14,000 | $87,320 |
| 2019 | $3,005 | $101,640 | $14,000 | $87,640 |
| 2018 | $3,005 | $101,640 | $14,000 | $87,640 |
| 2017 | $3,006 | $101,640 | $14,000 | $87,640 |
| 2016 | $2,999 | $101,411 | $14,000 | $87,411 |
| 2015 | $3,004 | $101,411 | $14,000 | $87,411 |
| 2014 | $2,457 | $83,182 | $14,000 | $69,182 |
| 2013 | -- | $88,028 | $14,000 | $74,028 |
Source: Public Records
Map
Nearby Homes
- 101 Sheffield Dr
- 102 Canterbury Dr
- 101 Kenwood Dr
- 91 Richmond Dr
- 896 Youngs Mill Rd
- 89 Chase Rd
- 109 Windridge
- 107 Windridge
- 92 Priscilla Dr
- 101 Crestwood Dr
- 107 Powers Ct
- 103 Powers Ct
- 106 Powers Ct
- 519 Tradition Place
- 510 Tradition Place
- 517 Tradition Place
- 117 Woodchase
- 127 Ashling Dr
- 106 Kildare Ct
- 108 Hunter Ridge Dr
- 401 Canterbury Dr
- 0 Sheffield Dr Unit 3 7426012
- 0 Sheffield Dr Unit 8764885
- 0 Sheffield Dr Unit 3 8168789
- 0 Sheffield Dr
- 405 Canterbury Dr
- 405 Canterbury Dr Unit 7
- 101 Stratford Place
- 402 Canterbury Dr Unit 54
- 0 Stratford Place
- 308 Canterbury Dr
- 502 Canterbury Dr
- 103 Stratford Place
- 102 Sheffield Dr
- 102 Stratford Place
- 102 Stratford Place Unit 12
- 309 Canterbury Dr
- 501 Canterbury Dr
- 306 Canterbury Dr Unit 52
- 101 Sheffield Dr Unit 3