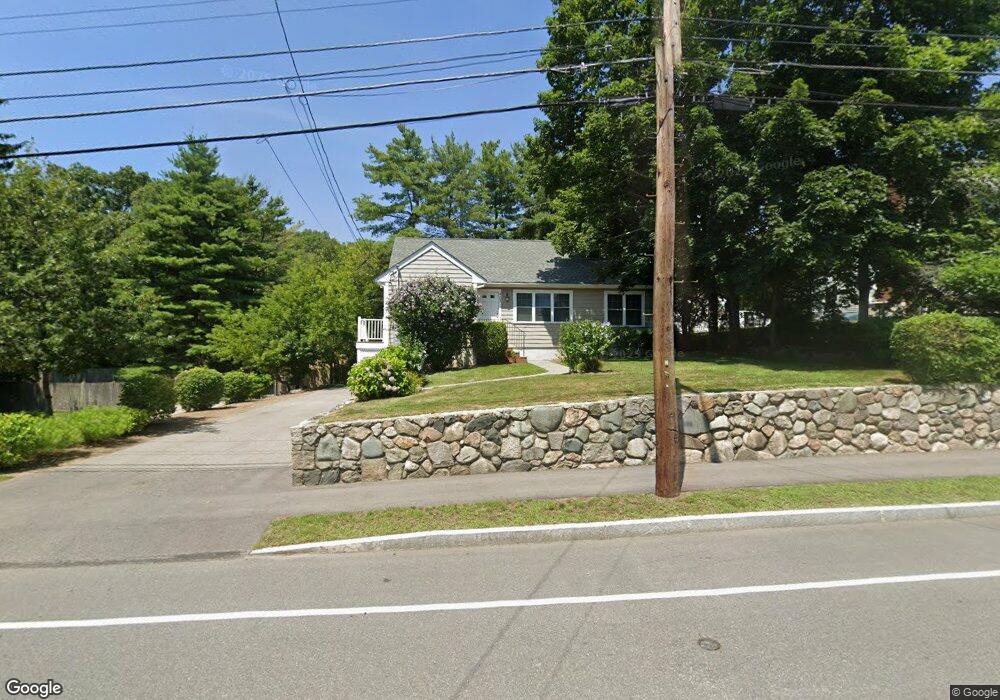
403 Central Ave Needham Heights, MA 02494
Estimated Value: $759,000 - $1,295,340
1
Bed
1
Bath
874
Sq Ft
$1,197/Sq Ft
Est. Value
About This Home
This home is located at 403 Central Ave, Needham Heights, MA 02494 and is currently estimated at $1,046,085, approximately $1,196 per square foot. 403 Central Ave is a home located in Norfolk County with nearby schools including Eliot Elementary School, High Rock Middle School, and Pollard Middle School.
Ownership History
Date
Name
Owned For
Owner Type
Purchase Details
Closed on
Nov 6, 2002
Sold by
Lavelli Kevin P and Lavelli Maureen H
Bought by
Petrini Corp
Current Estimated Value
Home Financials for this Owner
Home Financials are based on the most recent Mortgage that was taken out on this home.
Original Mortgage
$308,000
Outstanding Balance
$129,197
Interest Rate
6.04%
Mortgage Type
Purchase Money Mortgage
Estimated Equity
$916,888
Purchase Details
Closed on
Jun 3, 1996
Sold by
Hentschel Robert J and Hentschel Lauren P
Bought by
Lavelle Kevin P
Home Financials for this Owner
Home Financials are based on the most recent Mortgage that was taken out on this home.
Original Mortgage
$146,400
Interest Rate
7.91%
Mortgage Type
Purchase Money Mortgage
Purchase Details
Closed on
Aug 18, 1993
Sold by
Wayne Investment T
Bought by
Hentschel Robert J and Hentschel Lauren P
Create a Home Valuation Report for This Property
The Home Valuation Report is an in-depth analysis detailing your home's value as well as a comparison with similar homes in the area
Home Values in the Area
Average Home Value in this Area
Purchase History
| Date | Buyer | Sale Price | Title Company |
|---|---|---|---|
| Petrini Corp | $400,000 | -- | |
| Petrini Corp | $400,000 | -- | |
| Lavelle Kevin P | $183,000 | -- | |
| Lavelle Kevin P | $183,000 | -- | |
| Hentschel Robert J | $140,000 | -- | |
| Hentschel Robert J | $140,000 | -- |
Source: Public Records
Mortgage History
| Date | Status | Borrower | Loan Amount |
|---|---|---|---|
| Open | Petrini Corp | $308,000 | |
| Closed | Hentschel Robert J | $308,000 | |
| Previous Owner | Hentschel Robert J | $216,000 | |
| Previous Owner | Hentschel Robert J | $146,400 |
Source: Public Records
Tax History
| Year | Tax Paid | Tax Assessment Tax Assessment Total Assessment is a certain percentage of the fair market value that is determined by local assessors to be the total taxable value of land and additions on the property. | Land | Improvement |
|---|---|---|---|---|
| 2025 | $10,451 | $985,900 | $670,700 | $315,200 |
| 2024 | $7,848 | $626,800 | $408,800 | $218,000 |
| 2023 | $7,953 | $609,900 | $408,800 | $201,100 |
| 2022 | $7,451 | $557,300 | $365,000 | $192,300 |
| 2021 | $7,262 | $557,300 | $365,000 | $192,300 |
| 2020 | $6,967 | $557,800 | $364,900 | $192,900 |
| 2019 | $6,444 | $520,100 | $331,800 | $188,300 |
| 2018 | $6,179 | $520,100 | $331,800 | $188,300 |
| 2017 | $4,920 | $413,800 | $331,800 | $82,000 |
| 2016 | $5,012 | $434,300 | $331,800 | $102,500 |
| 2015 | $4,903 | $434,300 | $331,800 | $102,500 |
| 2014 | $4,776 | $410,300 | $325,300 | $85,000 |
Source: Public Records
Map
Nearby Homes
- 345 Central Ave
- 48 Taylor St
- 12 Hill St
- 10 Rosegate Rd
- 70 Briarwood Cir
- 4 Greenough St
- 23 Harvard Cir
- 5 Homsy Ln
- 212 Central Ave
- 62 Evelyn Rd
- 140 Hillside Ave
- 140 Hillside Ave Unit a
- 10 Fife Rd
- 132 Hillside Ave
- 134 Hillside Ave Unit 134
- 379 Hunnewell St Unit 379
- 218 Hillside Ave
- 18 Evergreen Rd
- 5 Sachem Rd
- 28 Mercer Rd
- 411 Central Ave
- 393 Central Ave
- 393 Central Ave Unit 1
- 393 Central Ave Unit 1,393
- 387 Central Ave
- 398 Central Ave
- 406 Central Ave
- 410 Central Ave
- 416 Central Ave
- 11 Jennifer Cir
- 386 Central Ave
- 4 Crane St
- 425 Central Ave
- 197 Pine Grove St
- 197 Pine Grove St
- 378 Central Ave
- 19 Jennifer Cir
- 433 Central Ave
- 11 Crane St
- 369 Central Ave
Your Personal Tour Guide
Ask me questions while you tour the home.