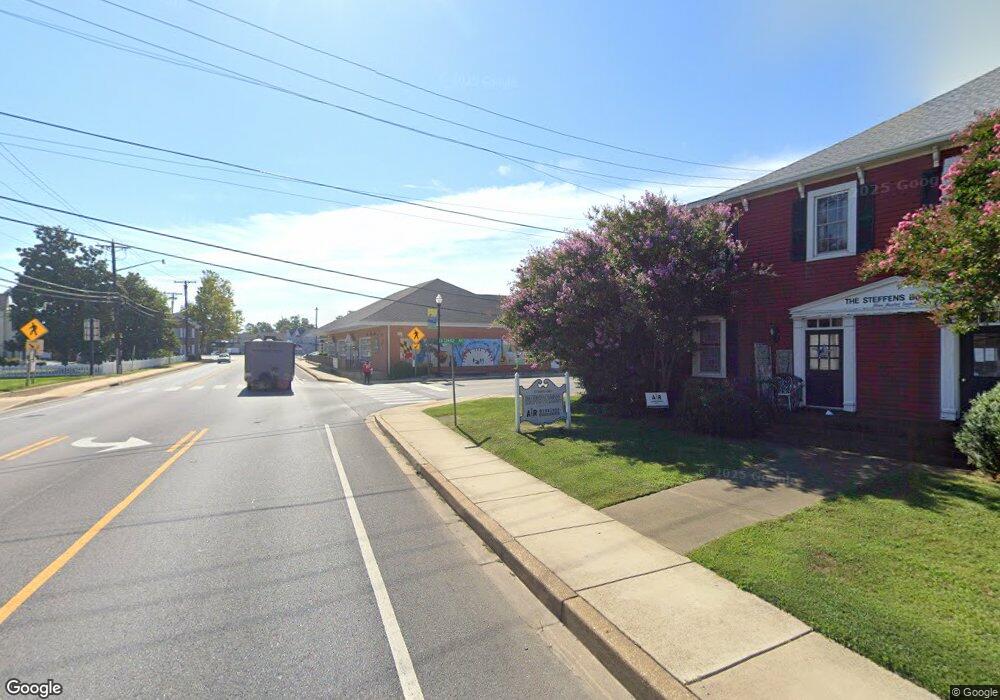
403 Charles St La Plata, MD 20646
Estimated Value: $2,944,574
--
Bed
--
Bath
17,661
Sq Ft
$167/Sq Ft
Est. Value
About This Home
This home is located at 403 Charles St, La Plata, MD 20646 and is currently estimated at $2,944,574, approximately $166 per square foot. 403 Charles St is a home located in Charles County with nearby schools including Walter J. Mitchell Elementary School, Milton M. Somers Middle School, and La Plata High School.
Ownership History
Date
Name
Owned For
Owner Type
Purchase Details
Closed on
Mar 9, 2021
Sold by
Kna Holdings Llc
Bought by
Murphy Family Llc
Current Estimated Value
Purchase Details
Closed on
Oct 17, 2016
Sold by
The Shadow Group Llc
Bought by
Kna Holdings Llc
Purchase Details
Closed on
Sep 15, 2016
Sold by
Howard A Libby Revocable Trust
Bought by
Tsg Matthews Llc
Purchase Details
Closed on
Sep 16, 2015
Sold by
Howard A Libby Revocable Trust
Bought by
The Shadow Group Llc
Purchase Details
Closed on
Sep 10, 2015
Sold by
Wgl Associates Llc
Bought by
Howard A Libby Revocable Trust and Elise Yuter Revocable Trust
Purchase Details
Closed on
May 30, 2014
Sold by
Wgl Associates Inc
Bought by
Wgl Associates Llc
Purchase Details
Closed on
Dec 14, 1998
Sold by
Mudd James A and Mudd Anne B
Bought by
Wgl Associates Inc
Create a Home Valuation Report for This Property
The Home Valuation Report is an in-depth analysis detailing your home's value as well as a comparison with similar homes in the area
Home Values in the Area
Average Home Value in this Area
Purchase History
| Date | Buyer | Sale Price | Title Company |
|---|---|---|---|
| Murphy Family Llc | $30,000 | Accommodation | |
| Kna Holdings Llc | $1,850,000 | Attorney | |
| Tsg Matthews Llc | -- | Attorney | |
| Howard A Libby Revocable Trust | -- | Attorney | |
| The Shadow Group Llc | -- | Attorney | |
| Howard A Libby Revocable Trust | -- | Attorney | |
| Wgl Associates Llc | -- | None Available | |
| Wgl Associates Inc | $1,225,000 | -- |
Source: Public Records
Tax History Compared to Growth
Tax History
| Year | Tax Paid | Tax Assessment Tax Assessment Total Assessment is a certain percentage of the fair market value that is determined by local assessors to be the total taxable value of land and additions on the property. | Land | Improvement |
|---|---|---|---|---|
| 2025 | $69,721 | $2,258,167 | -- | -- |
| 2024 | $34,462 | $2,257,933 | $0 | $0 |
| 2023 | $39,487 | $2,257,700 | $305,100 | $1,952,600 |
| 2022 | $33,692 | $2,251,900 | $0 | $0 |
| 2021 | $33,654 | $2,246,100 | $0 | $0 |
| 2020 | $33,654 | $2,240,300 | $316,100 | $1,924,200 |
| 2019 | $32,274 | $2,140,433 | $0 | $0 |
| 2018 | $30,638 | $2,040,567 | $0 | $0 |
| 2017 | $29,300 | $1,940,700 | $0 | $0 |
| 2016 | -- | $1,940,700 | $0 | $0 |
| 2015 | $25,895 | $2,345,467 | $0 | $0 |
| 2014 | $25,895 | $2,148,100 | $0 | $0 |
Source: Public Records
Map
Nearby Homes
- The Adelina Plan at Fischer's Grant
- The Westminster Plan at Fischer's Grant
- The Brentwood Plan at Fischer's Grant
- The Lancaster Plan at Fischer's Grant
- The Winchester Plan at Fischer's Grant
- The Willow Plan at Fischer's Grant
- The Oxford Plan at Fischer's Grant
- The Fairfax Plan at Fischer's Grant
- The Belmont Plan at Fischer's Grant
- The Glenwood Plan at Fischer's Grant
- The Hampton Plan at Fischer's Grant
- The Somerset Plan at Fischer's Grant
- The Ashland Plan at Fischer's Grant
- 107 Howard St
- 302 Edelen Station Place
- 9 Candleberry Dr
- 13 Candleberry Dr
- Lot 241 Washington
- 214B Washington Ave
- 14 Candleberry Dr
- 317 E Charles St
- 406 Charles St Unit 200
- 406 Charles St
- 406 Charles St Unit SUITE 102
- 406 Charles St Unit 202
- 101 La Grange Ave
- 404 Charles St Unit 100
- 404 Charles St
- 5 N Maple Ave Unit 200
- 5 N Maple Ave
- 5 N Maple Ave Unit 100
- 404 Charles St Unit 202
- 417 Charles St
- 5 S Maple Ave Unit 202
- 5 S Maple Ave Unit 200
- 5 S Maple Ave Unit 102
- 313 E Charles St
- 105 La Grange Ave Unit 110
- 105 La Grange Ave
- 320 Charles St